
Amazon is the largest e-commerce store in the world. Looking at it today, it’s difficult to fathom that it was once operated from a garage and only had one employee – Jeff Bezos. Though it now an enterprise that sells just about anything, it started as an online book store. Its growth was slow but steady. But despite the progress it was making, many investors wrote it off as another dot.com company that would be wiped out by giant stores at the time. But this never happened. Instead, its competition, the likes of Borders filed for bankruptcy in 2011 and has closed many of its stores.
Barnes and Noble are on shaky ground, and Amazon seems to thrive and succeed with every new category and product they added. Today, Amazon makes billions of dollars and has penetrated the lives of customers around the world. In this piece, we shall take a detailed look at the Beast that is Amazon and share the success it has had on its journey to date.
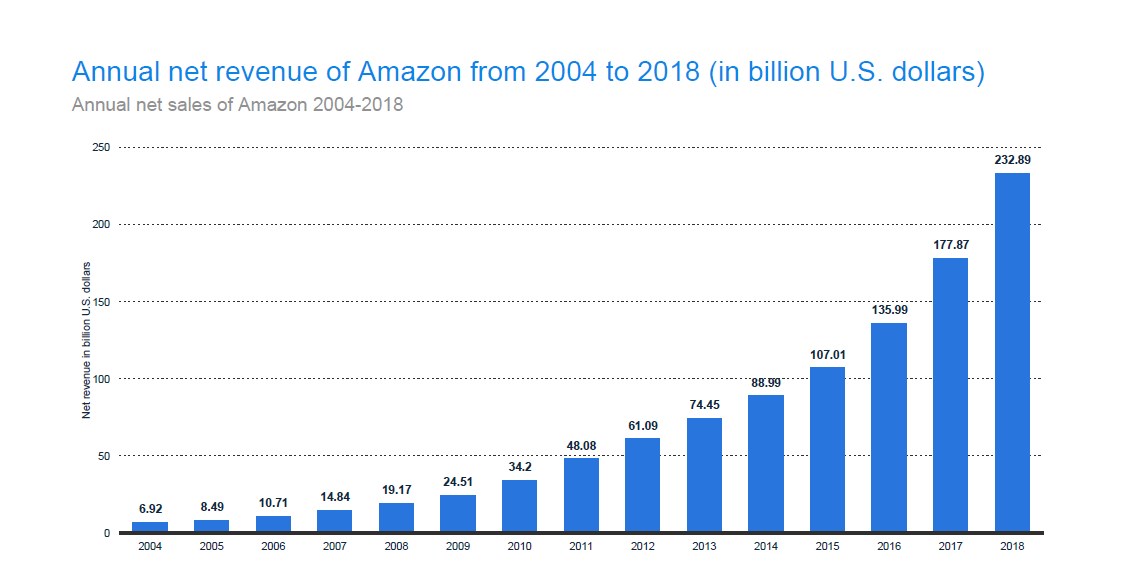
1. Annual Net Sales of Amazon 2004-2018
Amazon is one of the fastest growing company in history to hit the $100 billion in sales. According to Statista, it took about 20 years. In 2014, the annual company revenue rose from $88.99 billion to $107.01 billion in 2015. In 2018, the company’s revenue was $232.89 billion, which was a significant rise from $177.86 billion in 2017.
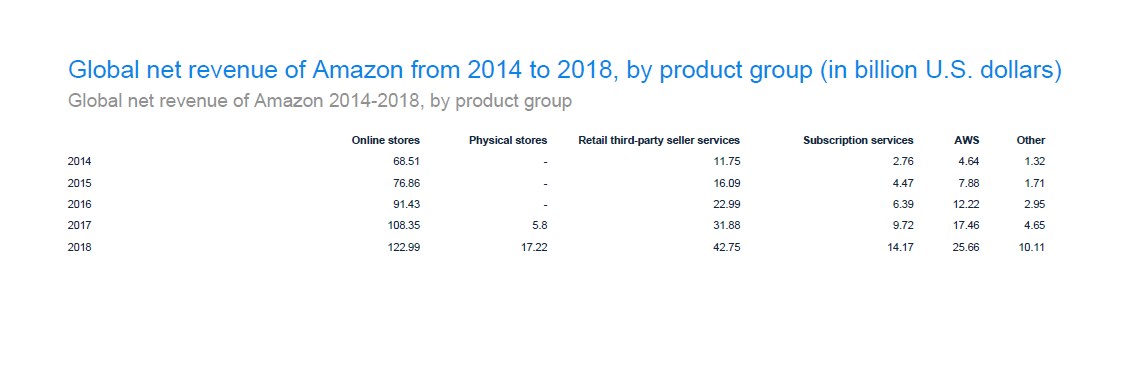
Now, by 2017, the company generated a lot of its revenue through product sales followed closely by 3rd part retail seller services, Subscription services like Amazon Prime and AWS. In addition to all this, Amazon is also the producer of the leading e-book reader in the world – Amazon Kindle.
On Amazon, customers get to purchase goods at discounted prices from large and small companies and other site users as well. You can get used and new products available at prices that undercut regular brick and mortar retail shops. Because of this, Amazon continues to dominate the industry. By last year, Amazon was worth $ 207 billion as a brand. It topped brands like Ikea, Walmart, and other big e-commerce platforms like eBay and Alibaba.
Amazon’s manufacture of the Kindle hardware took the e-commerce industry by storm. Today, Kindle is one of the most loved e-book readers in the world. But Amazon did not stop there. In the recent past, it has launched tablets, smartphones, and multimedia sticks under the Firebrand. And though this is not their primary line of business, it’s giving companies in the hardware industry a run for their money. Its ingenuity and boldness in taking on new challenges are one of the biggest reasons why its revenue growth curve continues to rise.
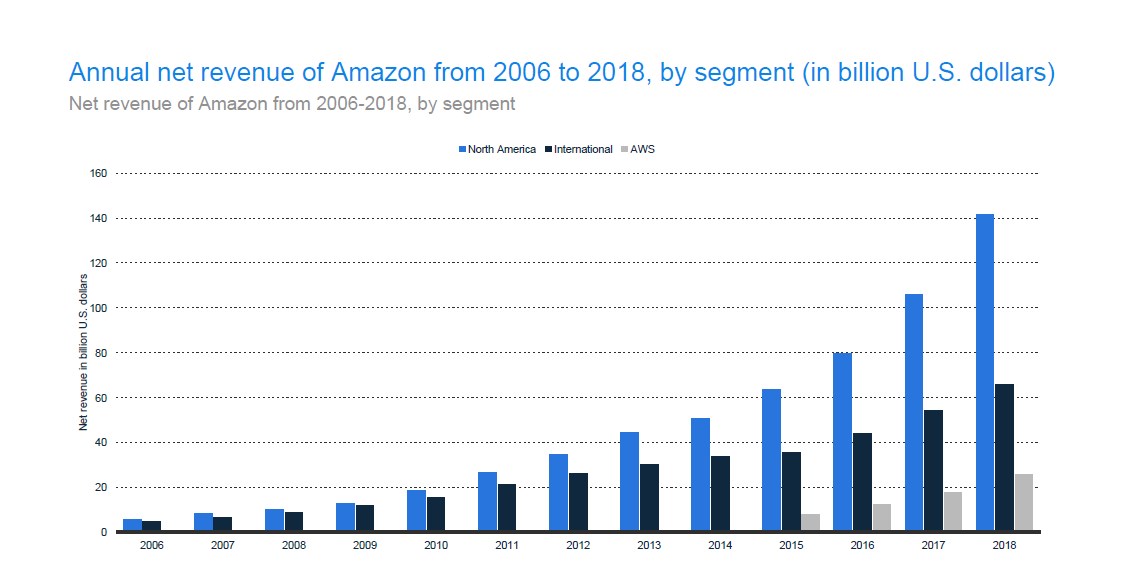
Given its location, Amazon offers many of its services to North America in comparison to other parts of the world. The preference reflects in the company’s revenue by segment. In 2018, the North American market contributed a little over $140 billion, while the international and AWS contributed about $63 billion and 23 billion respectively.
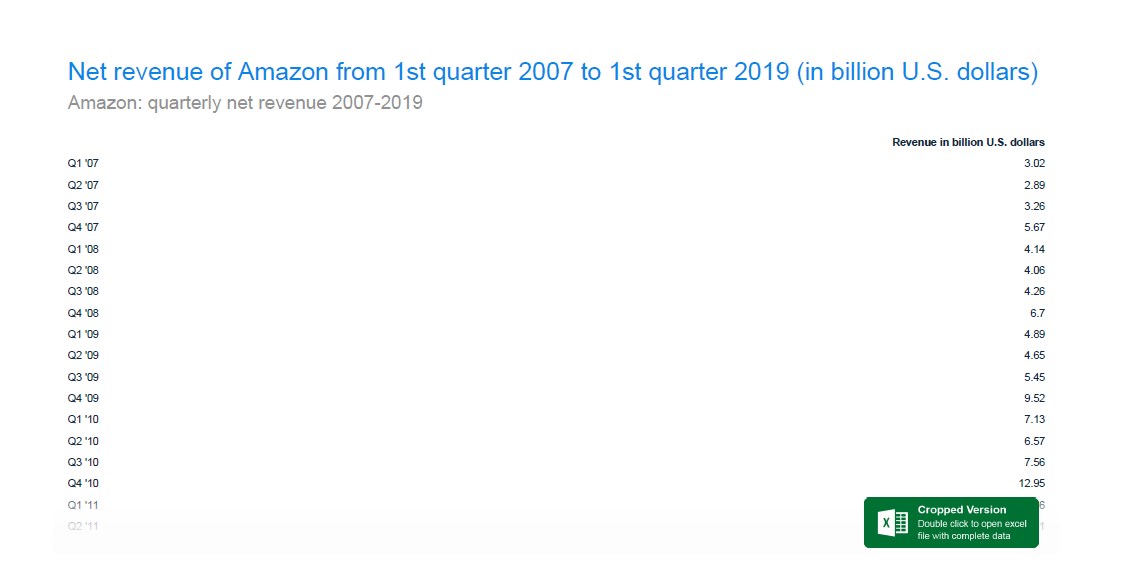
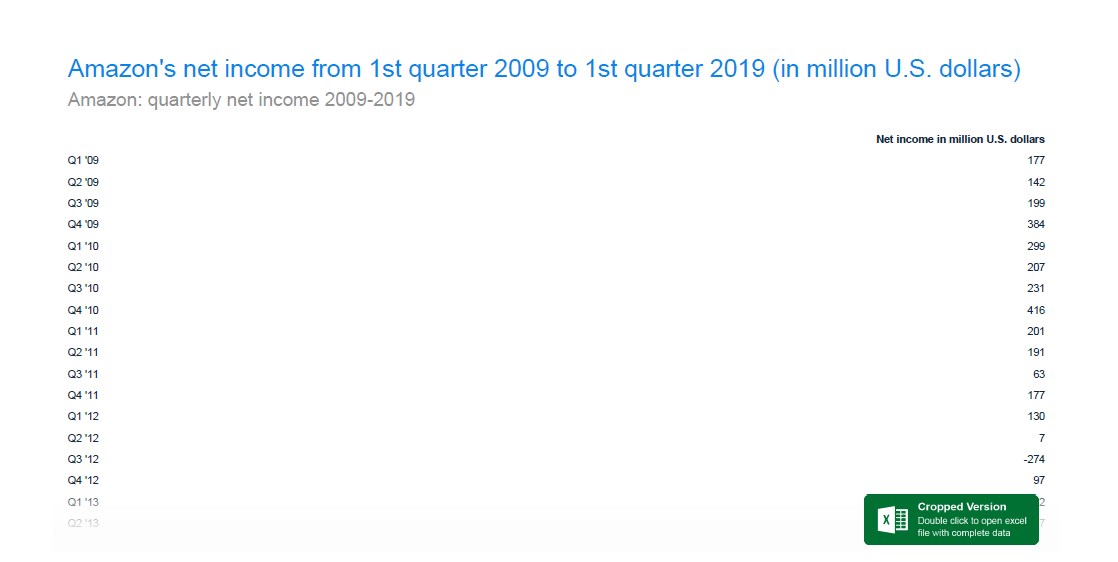
2. Amazon: Quarterly Net Revenue 2007-2019
If you look keenly, at the stats, you’ll notice that Amazon’s quarterly net revenue fluctuates. However, the collective annual revenue is constantly on the up and up. For instance, in 2007, the first four quarters were reported to have a net revenue of $ 3.02 billion, $2.89 billion, $3.26 billion, and $5.67 billion in that order. The annual income came to $ 14.84 billion. But in 2018, the annual revenue came to $ 19.12 billion a $ 4.3 billion increase.
In the first quarter of 2019, the net revenue was $59.7 billion, which was close to the revenue in 2017’s holiday season. In its reports of 2019, Amazon stated its net income came to $3.6 billion, and the earnings per share came to $7.09. Compared to net revenue of $51 billion, a net income of $1.6 billion, and earnings per share of $ 3.27 in 2018’s first quarter, this was a great job. Sales in North America were up by 17%, and international sales increased by 9%. These shares translated to $ 35.8 billion and $ 16.2 billion, respectively.
But according to analysts, Amazon was expected to earn $ 59.65 billion in net revenue and have earned $ 4.72 per share. Though Amazon fell short of the expected revenue, it crushed the expectations on earnings per share. In an official report, Amazon predicted its revenue in the second quarter in 2019 to fall between $59.5 billion and $63.5 billion. Analysts predicted a $60.88 billion revenue.
In all these, Amazon Web Services continue to lead the way. Its sales grew by 41% to $7.7 billion. As such, AWS contributed to about 13% of Amazon’s total revenue in 2019’s first quarter. And in case you were wondering AWS is by far the most popular cloud computing company. It’s ahead of Microsoft Azure and Google Cloud.
On the other hand, subscription services increased by 40% to about $ 4.3 billion. These services mainly include Amazon Prime, which Amazon is continually working on and expanding to offer deals in sectors like Whole Foods. As at mid-2018, Amazon Prime had over 95 million members in the US alone.
As for the other products include Alexa and Fire TV, Amazon prefers not to share numbers unless they are great. In their first quarter report, Fire TV has a little over 30 million active users. The focus of these projects is rarely on money but on the education initiatives they purpose to launch. Speaking of education initiatives, Amazon purposes to fund computer science classes in over 1000 high schools to allow young kids to explore coding early in life. And though Alexa seems to be doing great, Amazon isn’t ready to reveal the numbers associated with this likable product (https://venturebeat.com/2019/04/25/amazon-earnings-q1-2019/).
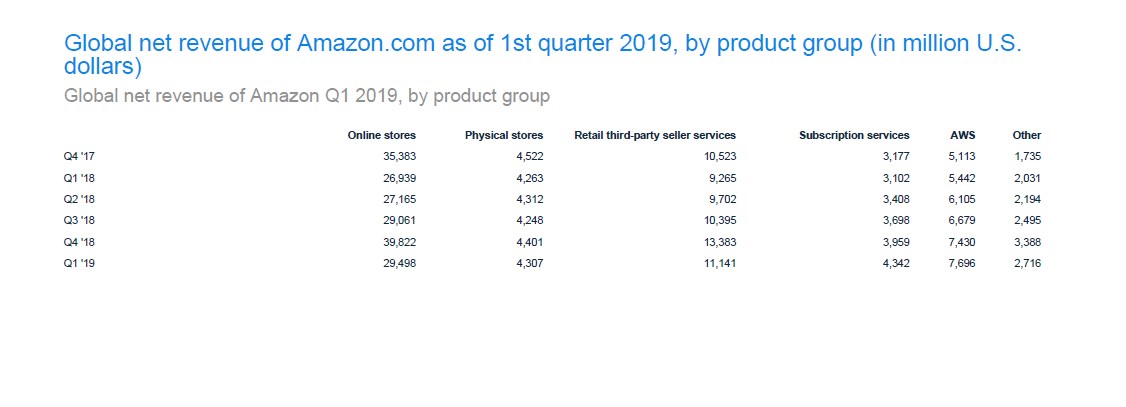
Lastly, it’s important we point out that a huge chunk of Amazon’s annual revenue comes from online stores worldwide. In 2019’s first quarter, the stores contributed about $ 29.498 billion, while Third-Party Retail Seller Services amounted to $11.141 billion. Coming in third is AWS followed by subscription services, physical stores, and finally others.
Amazon dives into physical retail
Wait, did we just say physical stores? Yes, you read that right. Since 2015, Amazon has been experimenting with physical stores ever since it realized it could not survive online alone. But today, what started as an experiment has caught on and proven to work. It has been opening spaces in shopping districts, malls, and local strip malls.
Part of the reason why Amazon decided to incorporate physical retail in its business model is that it noticed a significant increase in online sales in areas that have physical Amazon stores. The take back is that Brick and Mortar stores drive customer brand awareness and fuel the Amazon engine to greater success. Below is a breakdown of how Amazon has dived into the physical retail market to date.
Amazon 4-star sells items with more than 4-star ratings on Amazon online site
These stores include highly rated items. As such, the stores only have the best of the best. The first store of its kind was opened in SoHo neighborhood Manhattan. A couple more stores have since been opened in California, Berkeley, Lone Tree, Denver, and Colorado.
The store runs on the same principle as the Amazon Books store. However, it has a lot more categories and items on offer, including home and kitchen, games, and toys. Moreover, Amazon 4-star uses a cashless checkout system as well as the customer review process as seen on Amazon Books.
Amazon’s Pickup centers
These look more like post offices. As a customer, you can do two things while in these locations – pick up and return packages. These are the only things they are built to do. Instead of shipping packages to your home or office, you send them to the building’s address and pick them up from there. The packages are stored here for two weeks. If you need to return an item, you take it back to the location. And since you don’t have to send it through the postal service, returns are free. Though Amazon isn’t forthcoming with the exact number of such locations, we can confidently say they are more than 30 in the US.
Amazon Go
This is a futuristic store. It doesn’t have lines or a checkout process. The store sports cameras and sensors in all corners to keep track of every item you throw into your basket. Later, you pay through the Amazon account. Amazon has more than 6 Amazon go stores in locations including San Francisco, Chicago, and Seattle. Additionally, there are two amazon Go formats; one that focuses on some groceries and another that deals with freshly prepared foods and some snacks. Amazon intends to open more than 3,000 stores in the U.S.
Amazon in Whole Foods
We alluded to this at the start of this section. Amazon acquired Whole Foods, one of the biggest natural foods chain store in the U.S. Before Amazon came into the picture, it had over 450 stores. But with amazon’s might backing it up, it could be bigger.
Ever since the acquisition, Amazon has introduced Prime as part of a discount program in the national chain store. Currently, it works as part of a pickup and delivery option under Prime Now.
Amazon Strike a deal with Kohl’s
Kohl’s started accepting Amazon returns in 2017. It launched with 82 stores in Los Angeles and Chicago. Again, since no mail is involved in the return process, using Kohl’s for returns is free. And the beauty of it is that customers don’t have to bother packaging the items before dropping them off.
Some of Kohl’s stores also have an Amazon smart home experience. They achieve this through the sale of Amazon devices. This partnership has expanded to 100 Kohl’s stores in other areas, including Milwaukee.
Amazon Pickup in Universities
Yes, Amazon has bookstores in selected colleges and campuses in the US. It operates these bookstores in cooperation with the schools. Aside from providing books and stationaries to students, these outlets also double as Amazon pickup centers where customers can pick and return items purchased through Amazon e-commerce platform.
Amazon bookstore chains
Amazon has dipped its foot into the brick and mortar world through bookstores located in New York, Chicago, and Seattle. These stores work in the same way that the Amazon online bookstore does. It allows customers to browse through their selection in the same way it appears online. There are more than 17 stores set up.
Amazon Fresh
Amazon introduced a pickup for the Amazon Fresh. It is now called Prime Fresh. Customers who order groceries through Prime Fresh can collect them from locations in Seattle.
Amazon Lockers
These are set up in specific grocery stores. The Amazon lockers provide an alternative location for customers to receive their packages. These lockers are put up in convenience stores, grocery stores, and drug stores.
Amazon Pop Up stores to showcase devices
These stores are in malls all around the US. They are set up to provide customers with an excellent first-hand experience of their Amazon devices. They are great spots to try gadgets, including those with Alexa technology like Show, Look, Echo and e-readers like Fire tablets and Kindle.
Currently, there are more than 80 Amazon Pop-Up locations in the US. Some of these locations are in Whole Food chain stores and Kohl’s (as detailed earlier).
3. Best Selling Product Category
With the rise of Amazon affiliate business, more and more people want to know which category has the highest sale and consequently, the best category to invest in. Over the years, the trend has been quite steady and predictable. Despite the increase in revenue from the different categories, the ranking has remained fairly constant. It’s only in the recent past when things have been shaken up.
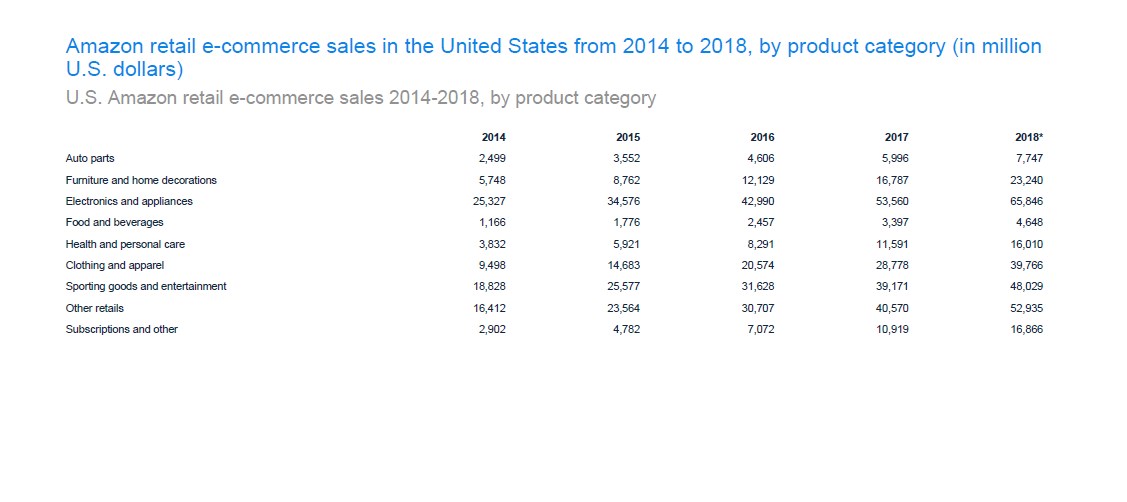
The electronics and appliance category has been leading the pack since 2014 when its sales were $25.327 billion in the US. The sales grew to $ 65.846 by 2018. Other categories that follow it closely in 2018 include other retail products, sporting goods and equipment, clothing and apparel, furniture and home décor, subscription services, health, and personal care and lastly, food and beverages and auto parts.
With the sudden need to stay in shape and to look good, it’s understandable why the sporting goods and entertainment, and clothing and apparel categories would be doing great. However, it’s worth noting that the subscription category wasn’t one of the best performing categories. It has risen to the top courtesy of the discounts it offers. In 2018, its sales were 16.866 billion, which was an increase from $ 2.902 billion in 4 years.
4. Amazon Operating Income
Operating income refers to the amount of profit gotten from specific business operations after subtracting operating expenses, including depreciation, wages, and cost of goods the company sells. Simply put, it’s the gross income minus operating expenses. Companies want the operating income to be positive.
For Amazon, the operating income has been on a steady increase since 2014 when North America, International markets and AWS recorded $360 million, $ -640 million and $ 458 million in operating income respectively. In 2018, four years later, the operating incomes were $7.267 billion, – $ 2.142 billion and $7.296 billion for North America, International and AWS respectively.
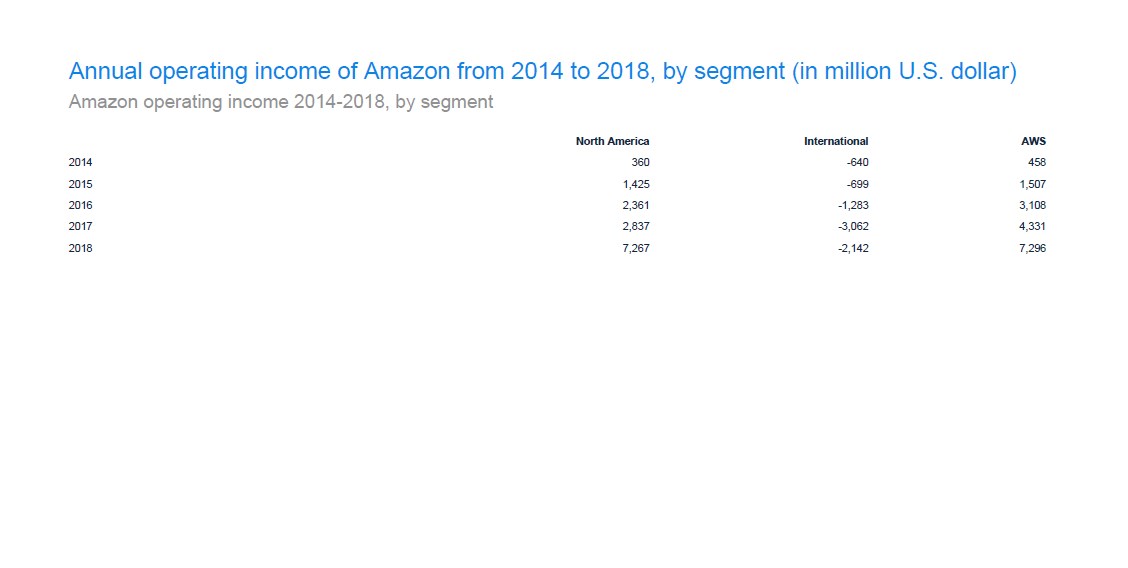
Have you noticed that the international operating income is negative? Well, this is because Amazon spends more than it sells internationally. And while this is usually a bad thing, on the bright side, it means Amazon doesn’t have to pay income tax for the said amount.
5. Net Income and Most Expensive Acquisition
Here’s a fun fact, it took Amazon 14 years to make as much profit as it did in 2018. In 2018, the company made an insane $10.073 billion in profits. And this was after making losses in 2012 and 2014. Yes, even companies as big as Amazon make losses, but they bounce back. In the times when the company made losses, Bezos wasn’t moved.
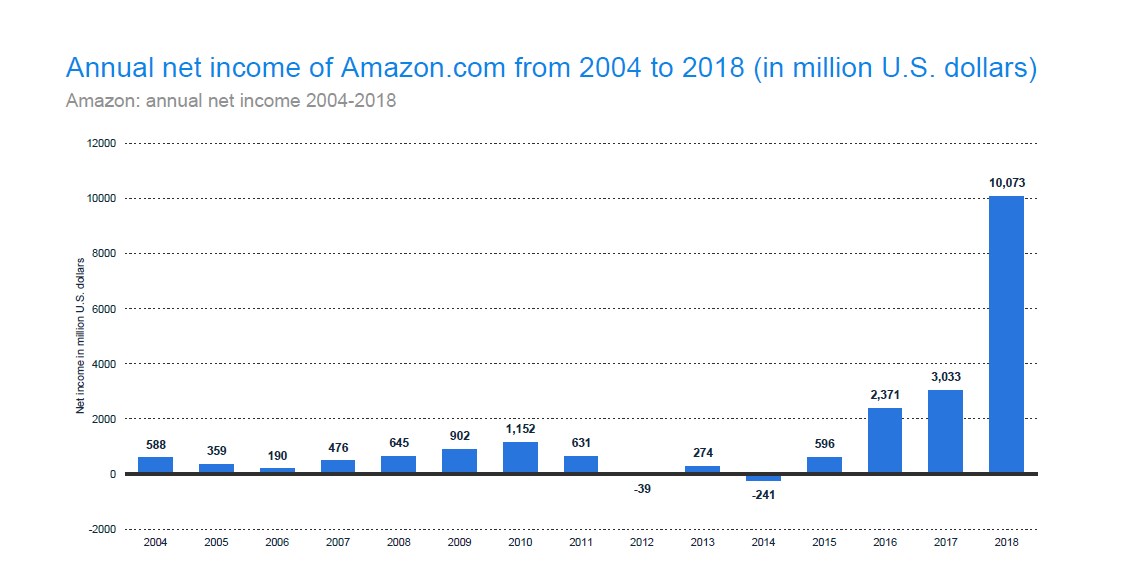
He didn’t falter or waver from his vision. Instead, he insisted that investing in future growth was far better and more critical than hitting quarterly and annual earnings targets.
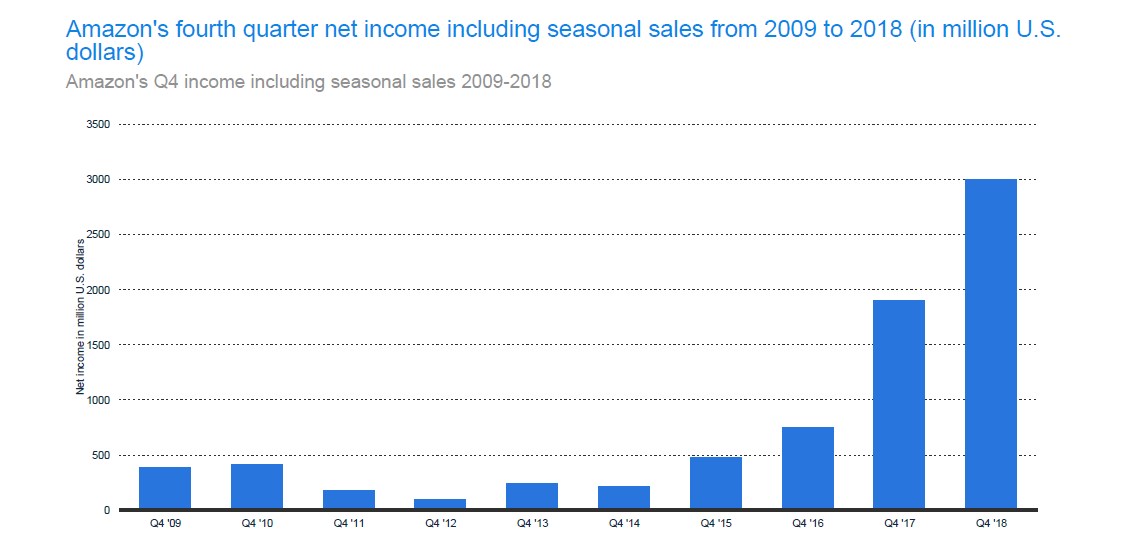
Speaking of quarterly earnings, Amazon seems to bounce back from losses and make a lot of profit during the holiday season probably because many are in the shopping spirit and are getting their family and loved ones gifts or revamping their houses. In 2018, Amazon made $3 billion in the fourth quarter.
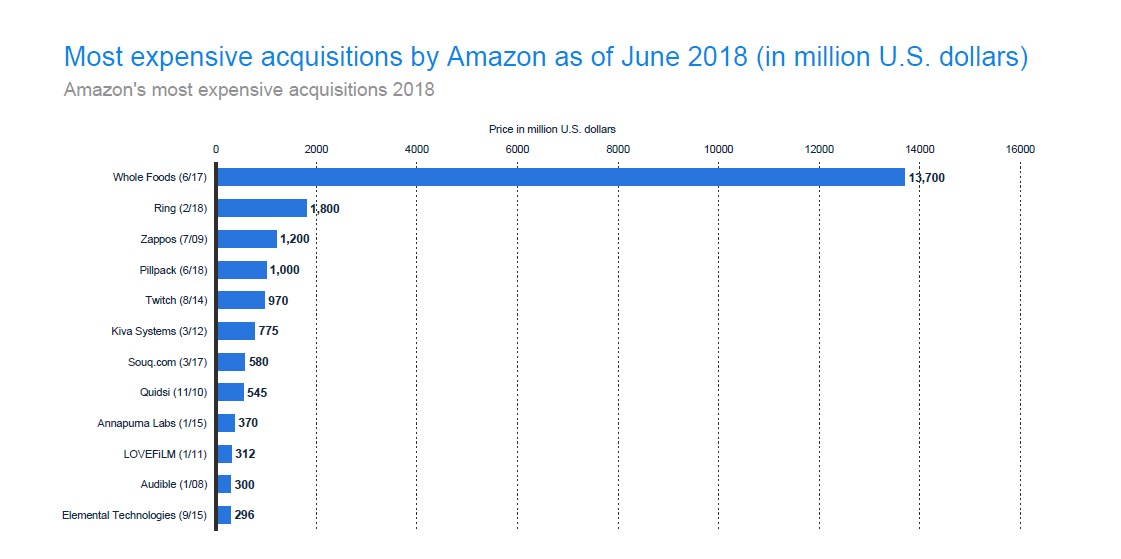
So, why did 2018 record such high profits? Well, experts speculate it’s because of the Whole Foods acquisition in 2017. Actually, this acquisition was one of the most expensive that Amazon has spent on so far. Other companies it has acquired over the years and that have contributed to the company’s growth and success include ring, Zappos, Kiva systems, Souq.com, Twitch, Audible, Quidai, and LOVEFILM.
Whole Foods’ acquisition was important because Amazon set up pick up stations in the 450 chain stores, which have gone on to improve the quality of the brand name and efficiency of the company. As it turns out, it helped the company to make $10.073 billion in 2018.
6. Number of Employees
The number of Amazon employees continues to grow steadily. The e-commerce giant hit the 600,000 employee milestone in 2018 for the first time. It currently tops Google and Microsoft. As of 2018, the number of employees was 647,500, which was a rise from 566,000 employees in 2017. In these two years, Amazon has almost doubled its employee base.
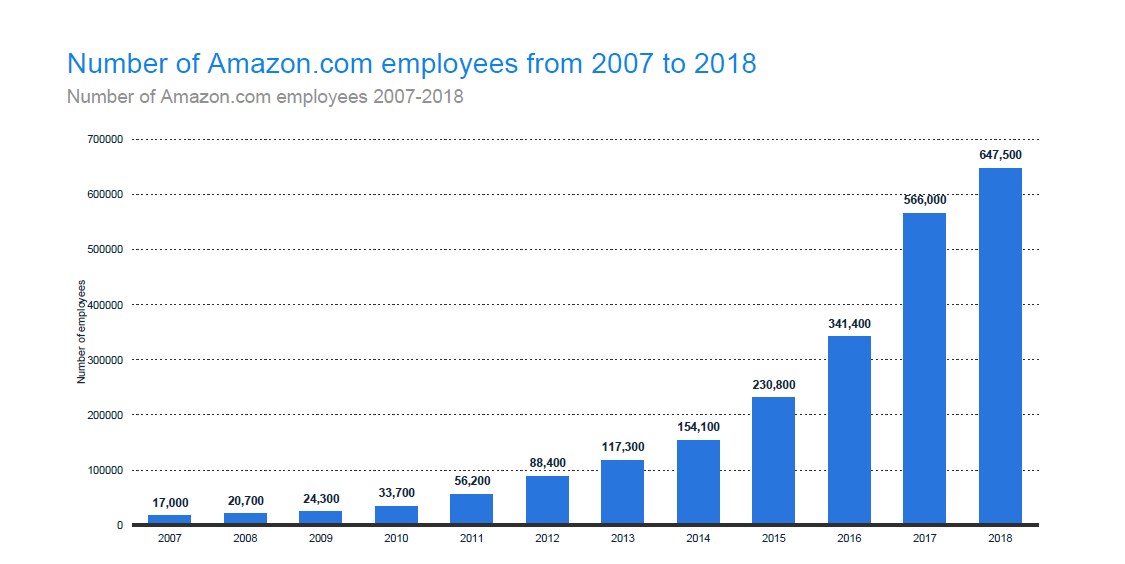
It’s important to note that the number includes part-time and full-time workers. It, however, excludes temporary personnel and contractors. Again, the reason behind the increase in the two years is the acquisition of Whole Foods. The Food store chain came with 87,000 employees.
Additionally, according to Brian Olsavsky, the Amazon CFO, 2/3 of Amazonians will get a pay rise. This means that close to 400,000 employee’s pay will be affected by the $15 an hour minimum wage.
7. Amazon Fulfillment Spending and Advertisement Cost
Amazon has a structural advantage in comparison to traditional retailers – they don’t shoulder the burden of maintaining large physical stores (even though Amazon has opened a couple of these). You see, depending on physical stores for the primary revenue in an environment where the sales are moving online is the leading cause of retail bankruptcies. The few retail stores that are either closing shop or being forced to adjust fast.
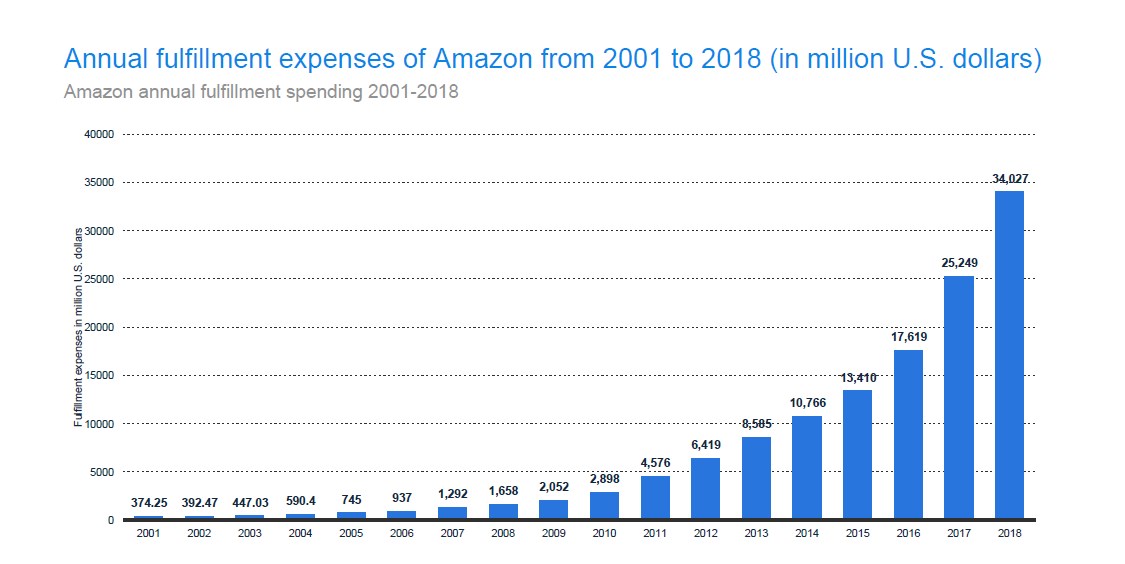
But online shops have their fair share of expenses. Shipping and fulfillment costs are at the top of the list. It is usually cheaper to ship trucks of items to stores than to ship single items to customers. Amazon spent a whopping $34.027 billion in 2018 in fulfillment cost. This was an increase from 2016’s and 2017’s $ 17.619 and $ 25.248 billion respectively.
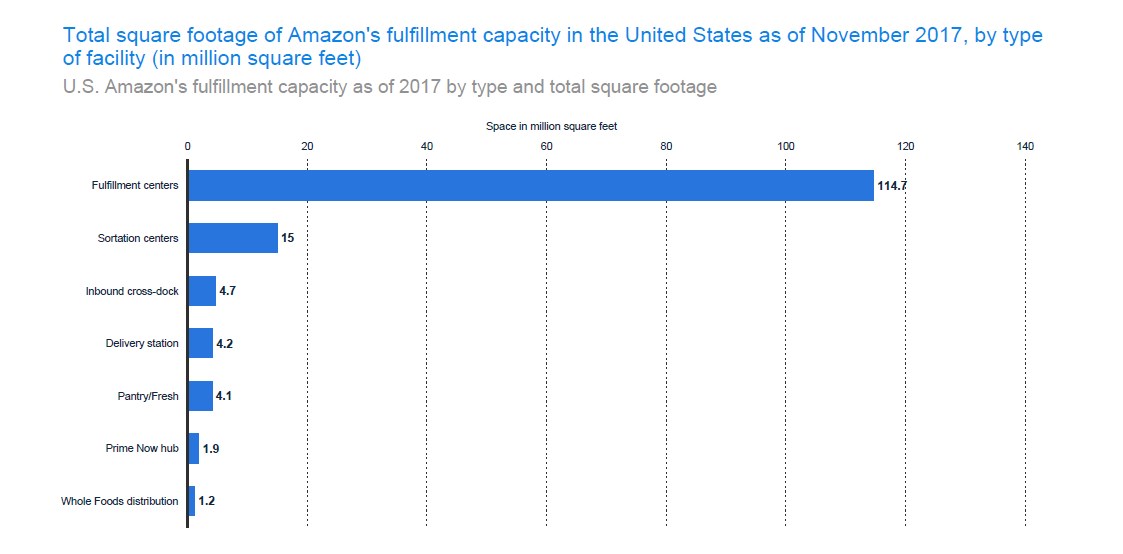
Speaking of fulfillment costs, Amazon’s fulfillment capacity varies from various centers and outlets. The recent acquisition (Whole Foods) as of 2017 had the least fulfillment capacity in square footage. Its capacity was at 1.2 million square feet. The top 3 were dedicated fulfillment centers, Sortation centers and inbound cross-docks with 114.7, 15 and 4.7 million square feet respectively. Other fulfillment centers include delivery stations, Pantry, and Prime Now hub.
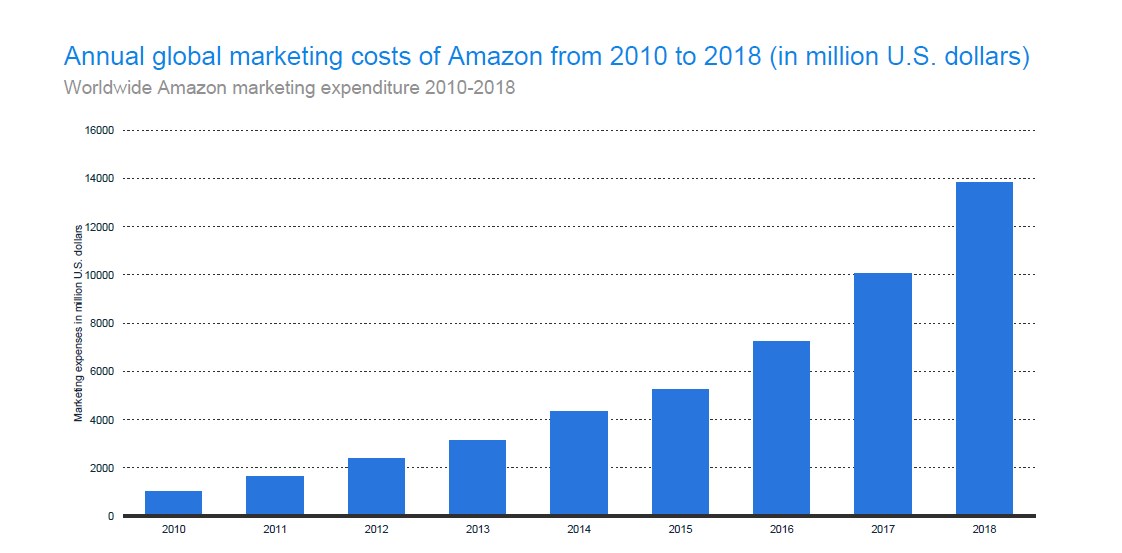
The other costs that drive down Amazon’s profit margins are advertisement and marketing costs. The amounts spent are intended to drive traffic to their current acquisitions or its main website. In 2018, Amazon spent close to $ 14 billion in marketing. This is a huge increase from less than $ 2 billion in 2010 and 2011.
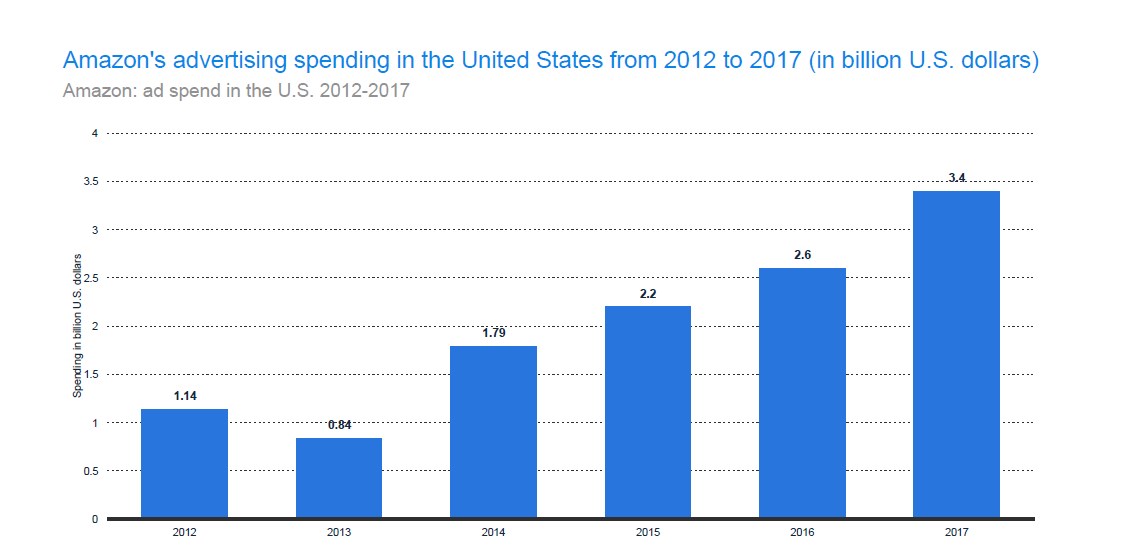
As for advertising, Amazon spent $ 1.14 billion in 2012. This figure has been increasing, and it hit $ 3.4 billion in 2017.
8. Amazon’s Brand Value
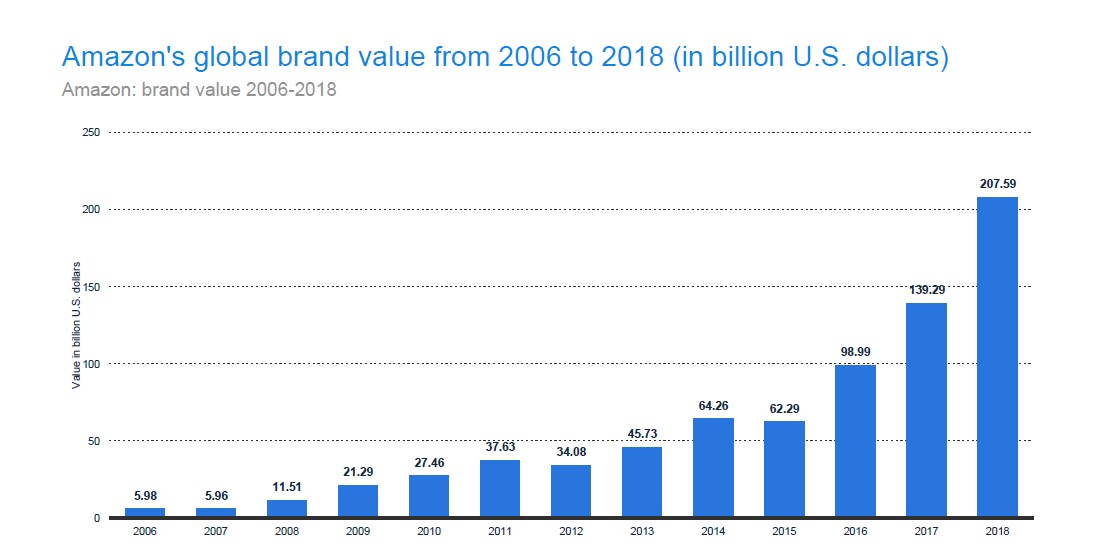
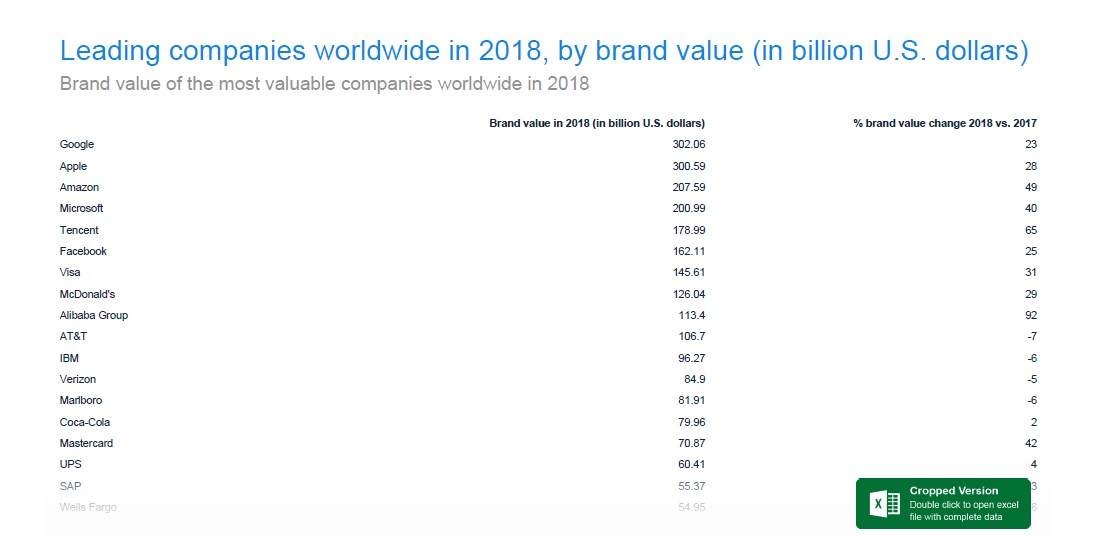
Amazon experienced minimal changes in brand value between 2006 and 2015. However, from 2016, its brand value skyrocketed. By 2018 Amazon’s global brand was valued at $ 208 billion. This was an increase of 109 billion in two years. Because of this, Amazon was ranked as the third most valuable brand after Apple and Google.
However, in 2019, the figures have changed, and Amazon is now the leading brand at $315.5 billion ahead of Apple and Google, which are valued at $ 309.5 billion and $309 billion, respectively.
Part of the reason the brand’s value has grown so much in the past two years is because of the excellent user experience, and customer support they provide. In addition to this, its wide range of products in food, electronics, subscription services, and beauty categories have played a big role as well.
9. What people think about tech and internet brands
Many technologies and internet brands were formed in the late ’90s and the early 2000s. But despite being relatively young, they are influencing the world in phenomenal ways. Their presence is felt in the banking, real estate, health, and entertainment sectors. Many people have embraced this technology. In North America, more than 89% of the population is online and use these platforms.
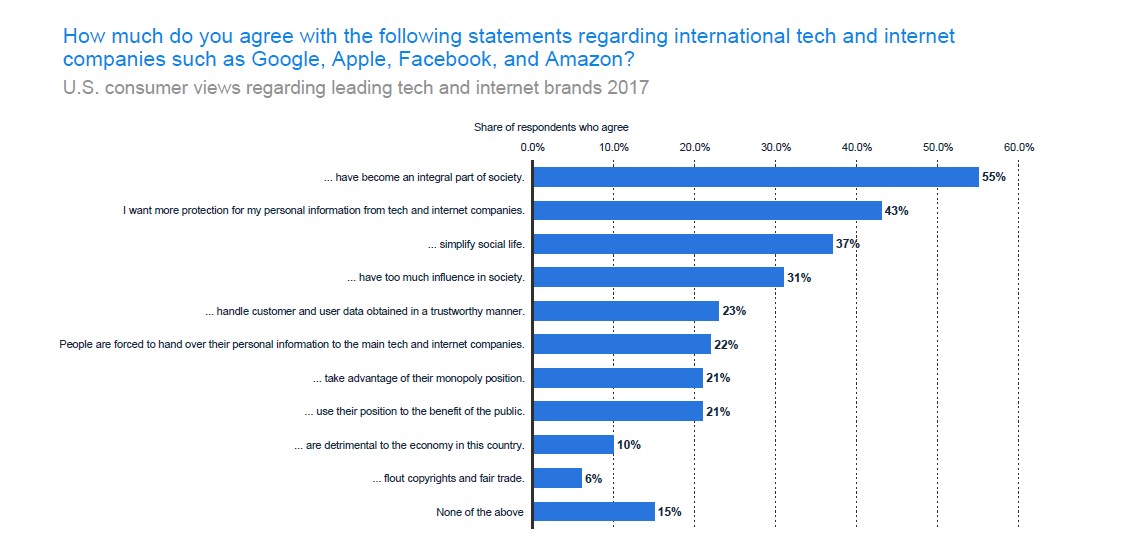
According to Statista, 55% of people feel that the top tech and online companies, including Facebook, Google, Apple, and Amazon, have become a significant part of the 21st-century society. However, about 43% feel they need more privacy and information protection from these companies. This is in light of recent news of Facebook selling user information to third-party companies. Also, about 37% of those surveyed stated that they feel these companies have simplified social life.
10. What people think about Amazon
The human brain is hard-wired to think critically, evaluate, interpret information, and pass judgments. Usually, opinions are passed in split seconds based on appearance, communication, and actions. At times, the reaction is automatic, and we might not realize it. Luckily, Amazon has had more than two decades to influence consumer opinion.
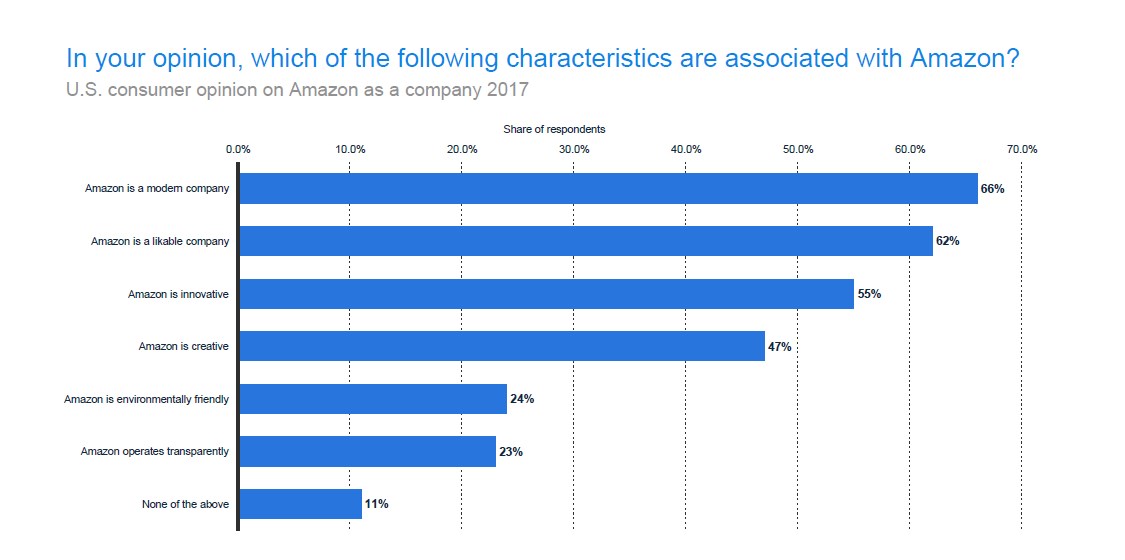
According to a survey conducted by Statista, 66% of the respondents associate Amazon with being a modern company, while 62% feel Amazon is likable. 55%, 47%, 245, and 23% of the respondents think that Amazon is creative, environmentally friendly, and transparent, respectively.
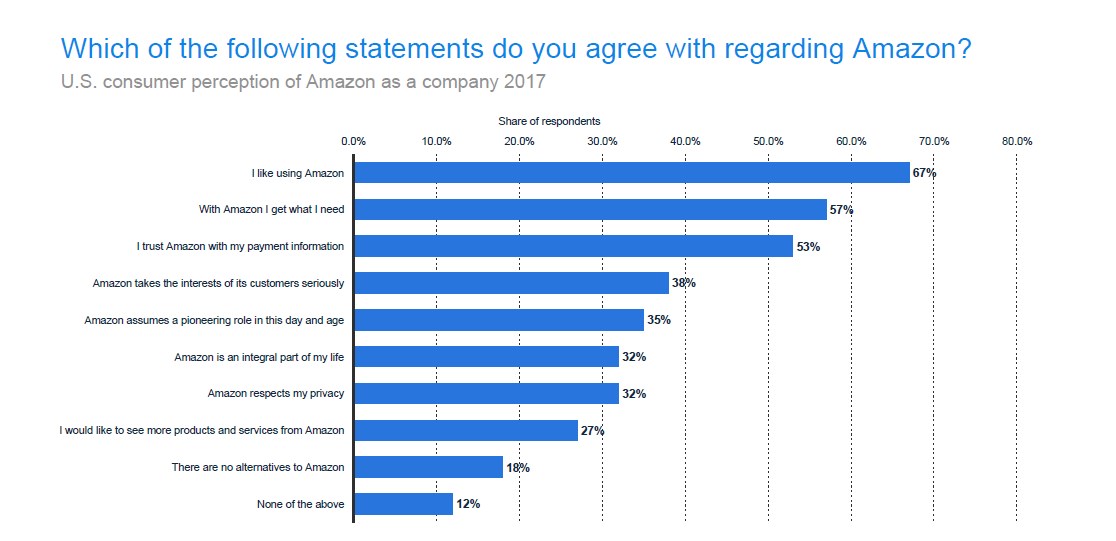
In addition to the above, according to a survey conducted in 2017, 67% and 57% of respondents said that they like using Amazon and that they always get what they need from it, respectively. Only 18% of respondents stated that there is no replacement/alternative for Amazon.
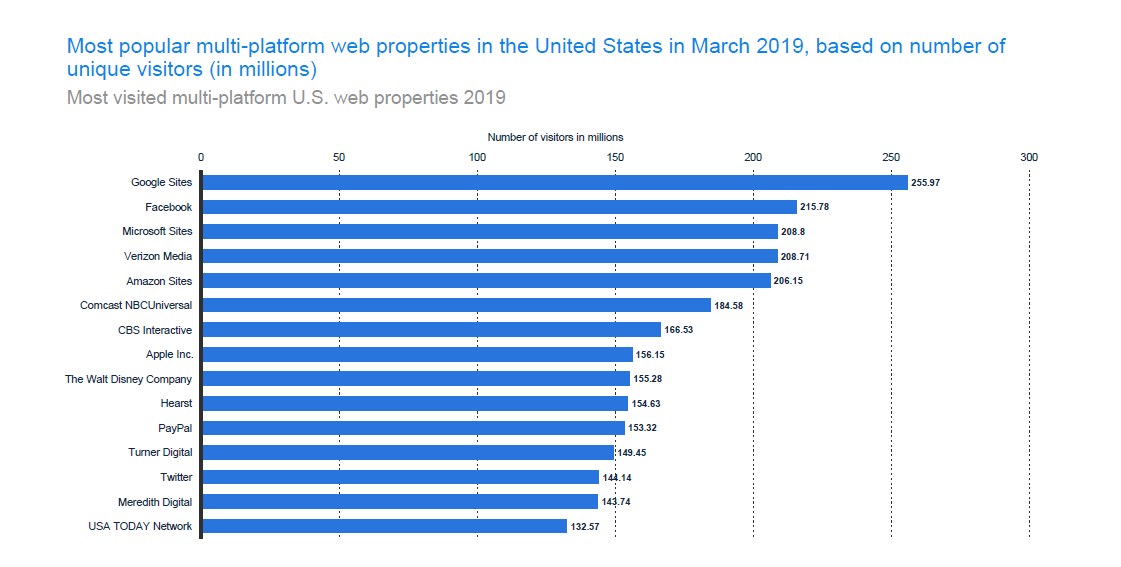
11. Most Visited Online Site
Just like a brick and mortar business, online businesses also depend on user traffic to succeed. This means that the more traffic a site gets, the higher its chances of success are. According to Statista, by May of 2019, Amazon was ranked 5th based on the number of visitors it had. It received about 206.15 unique visitors. It was defeated by Google sites, Facebook, Microsoft sites, and Verizon Media. Google triumphs in this area because of its mobile and desktop services, like Google Search engine, YouTube, Hangouts, and Gmail, as well as Maps and Apps from Google Play.
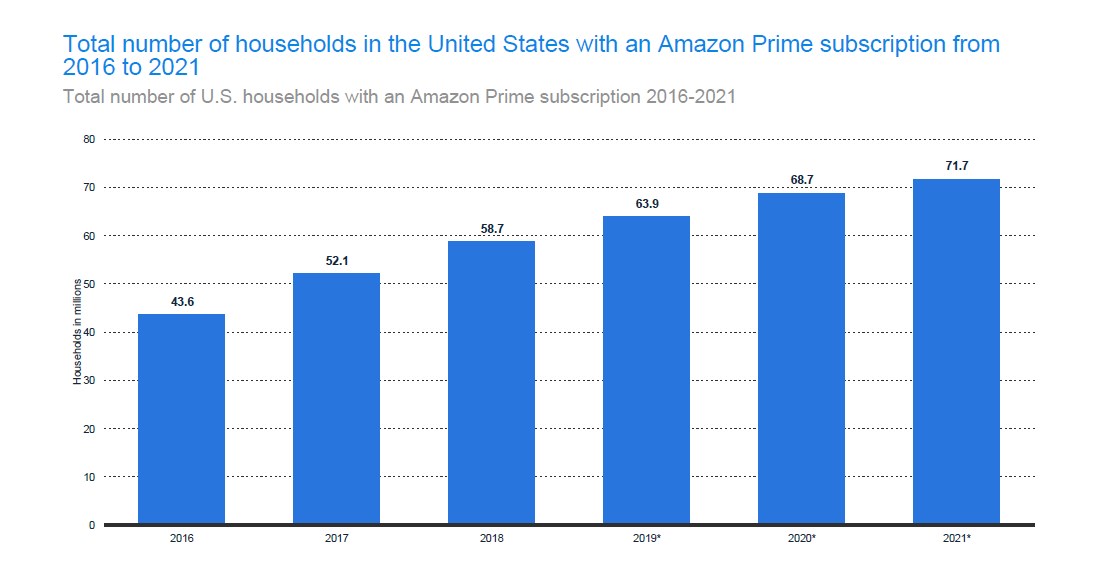
12. Number of U.S. Households with an Amazon Prime Subscription
According to Statista, about 53.6% of households in the US will have an Amazon Prime subscription by the end of 2019. This number will be equal to 63.9 million households. The growth of Amazon Prime membership will be fueled by low-income households along with others who are on the fence and will be lured in by the new and affordable installment plan.
Initially, when Amazon Prime was launched in 2014, the subscription cost was $79. However, it was increased to $99 and later to $119 in May of 2018. However, this year, Amazon Prime is set to introduce new payment options, which include $12.99 month and a student membership at $59 a year. For those on government assistance, Amazon will charge only $5.99 a month.
Additionally, new memberships are driven by the ever-increasing Prime categories, including Pantry, apparel, and groceries. Another significant advantage and incentive is the launch of Amazon household, which allows family members to share their linked accounts of Prime content and shopping.
All of this fits into Amazon’s grand plan and vision of increasing sales and consequently, their profit. How? Well, it’s been noted that Prime users tend to spend more on Amazon than non-Prime users. The average is $1400 annually vs. $600 annually for prime and non-prime users, respectively (slide 73).
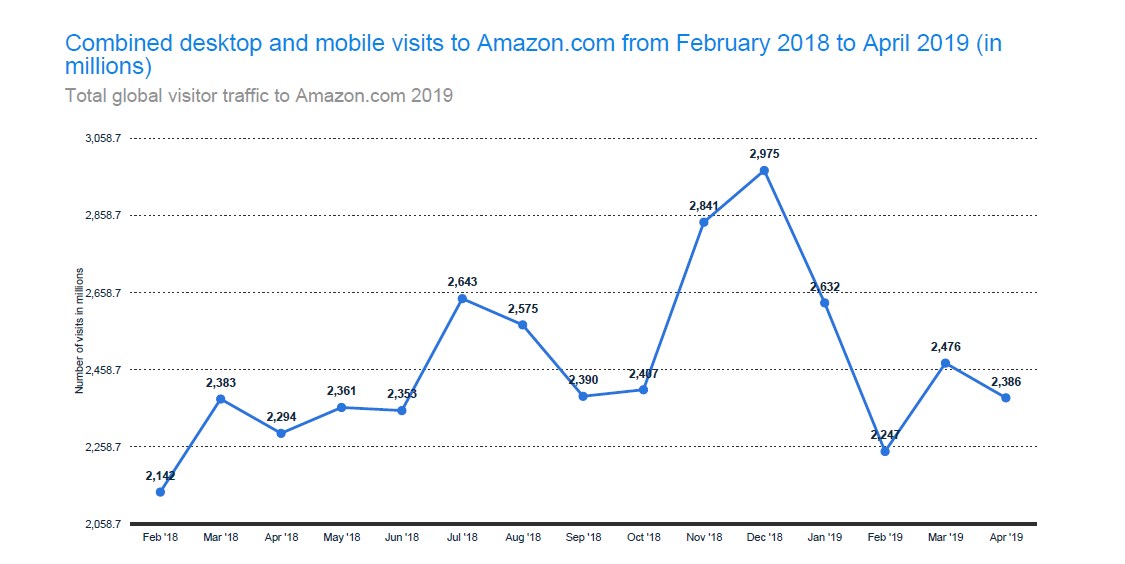
13. Global Visitor Traffic to Amazon.com 2019
The results are of both desktop and mobile. In a year, the number of visitors on Amazon fluctuate based on a number of factors. It has been noted that traffic increases around holidays and celebrations. For instance, between October of 2018 and December of 2018, there was a steady increase in visitations. However, between December and February of 2019, the numbers took a major dive from 2.975 billion to 2.247 billion visitors.
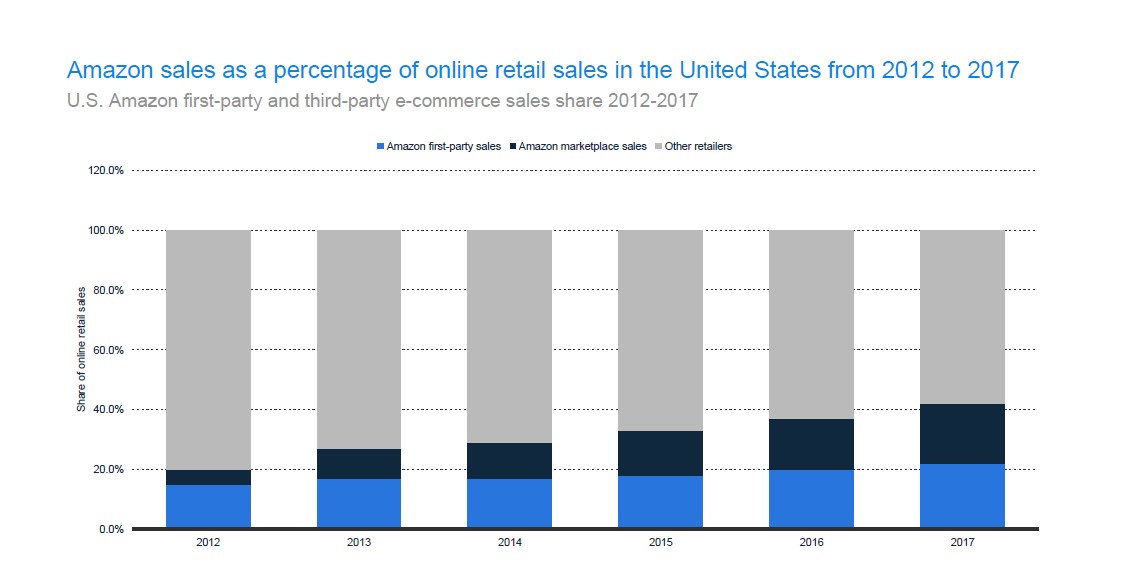
14. U.S. Amazon First-party and Third-party E-commerce Sales Share 2012-2017
The data provided by Statista shows the breakdown of Amazon sales in the US between 2012 and 2017. In 2012, Amazon first part plus Amazon market sites accounted for 20% while other retailer accounted for 80%. However, as Amazon has continued to grow, the sales share held by first-party sales and Amazon market have increased to 42% while other retailers have dropped to 58%.
15. Worldwide Amazon Online Retail Sales Market Share
Amazon.com is a worldwide e-commerce platform. But despite this, it has focused its sights on the US market. Because of this, it’s not a shock to find that some countries are locked out from some services. Over the years, Amazon.com has been experiencing a gradual increase. The share of retail sales has increased from 38.3% in the US in 2016 to a projected 52.4% in 2019.
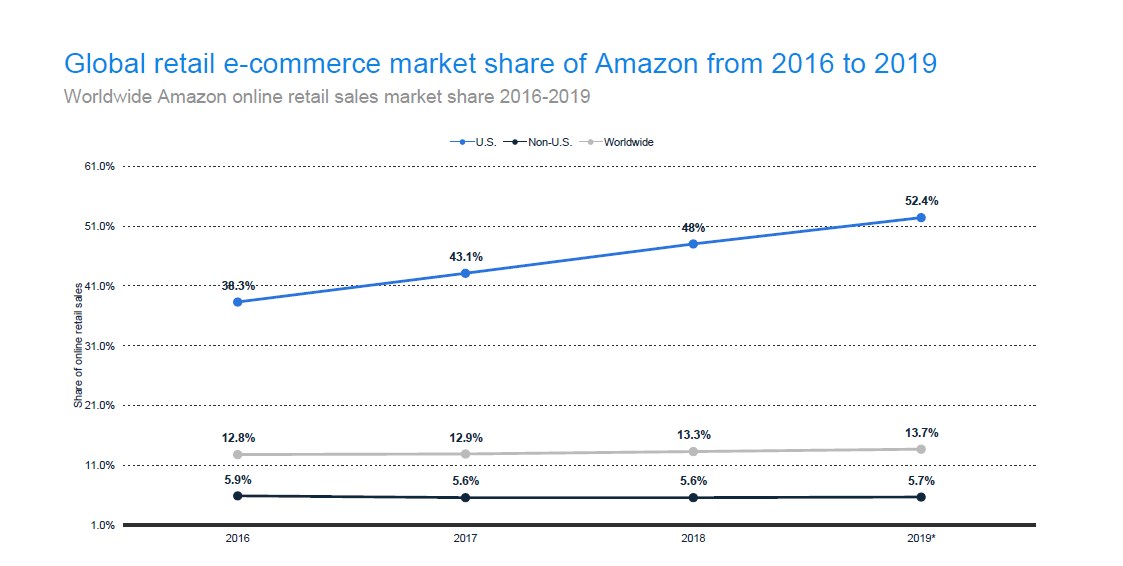
On the other hand, sales growth in the world has only increased by 0.6% over three years. But even worse, sales to no-US users have barely increased over the years. Only 0.2% increase has been observed.
16. U.S. Amazon Sales Share of Selected Top-level Categories 2018
Amazon.com is not the only e-commerce site in the world. There are a couple of reputable names including, Aliexpress, Alibaba, Walmart, eBay, Wish, Target, and Etsy.com. Users have in the past decade turned to these sites for most of their purchases.
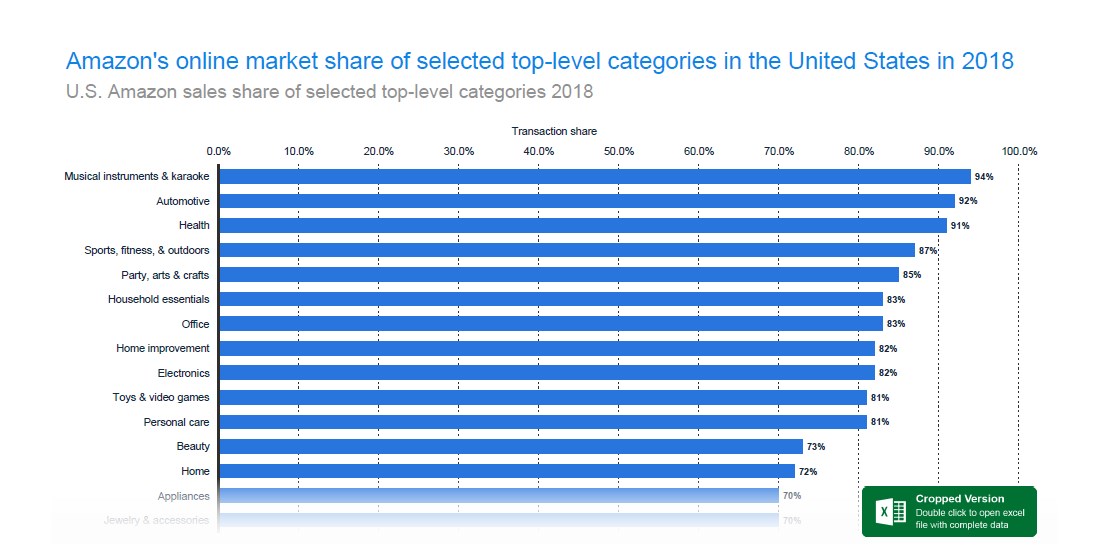
Now, since Amazon is the leading e-commerce store in the world, it only makes sense that a huge chunk of purchases are from it. According to Statista, 94% of karaoke and musical instruments bought online are bought from Amazon sites. Additionally, Automotive, Health, Sports and Fitness, Art and crafts and household essentials follow with 92%, 91%, 87%, 85%, and 83% respectively.
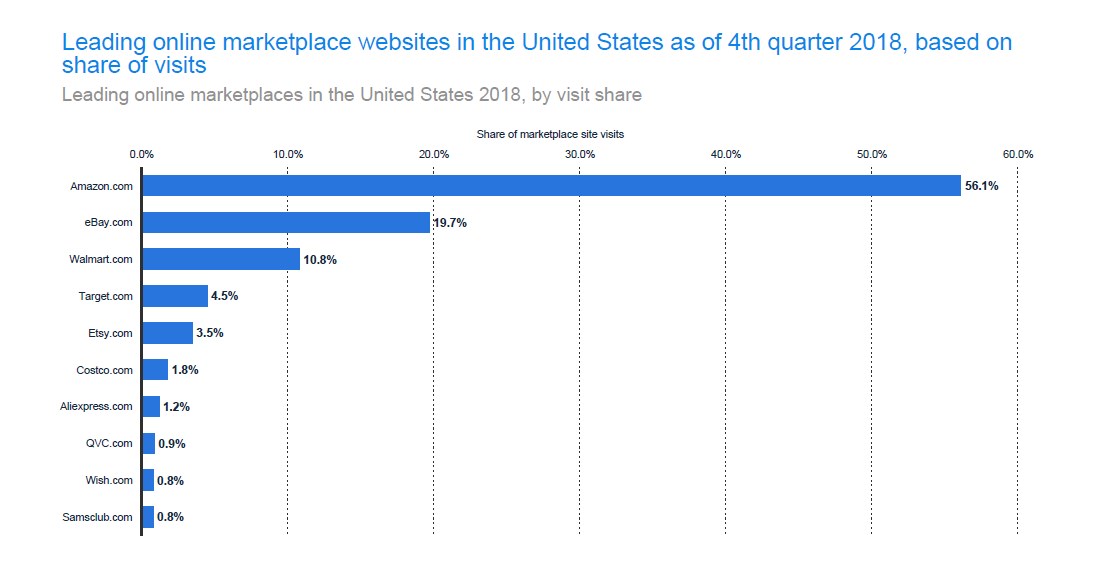
17. Top US Market Place Based on Number of Visits
It’s no secret that there are many e-commerce sites in the US. Amazon faces stiff competition and has over the years had to prove itself and support its position. But in the past couple of years, it has secured its place in the top position based on the number of visits. Amazon is in 1st place with a visit share of 56.1%. The closest competitor is eBay, which comes in with a 19.7% market share and then Walmart with 10.8%. QVC and Aliexpress are at 0.9% and 1.2%, respectively.
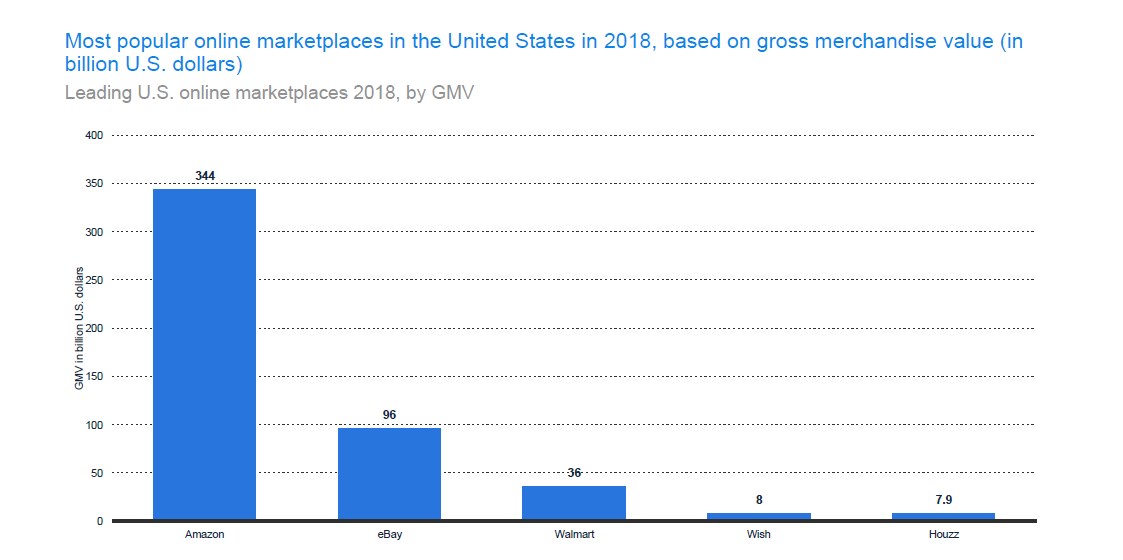
18. Most Popular E-commerce Site based on Gross Merchandise Value
Gross merchandise value refers to the total value of merchandise that is sold over a defined period by a company. It is what financial experts use to measure business growth. It’s often used to determine the health of a site.
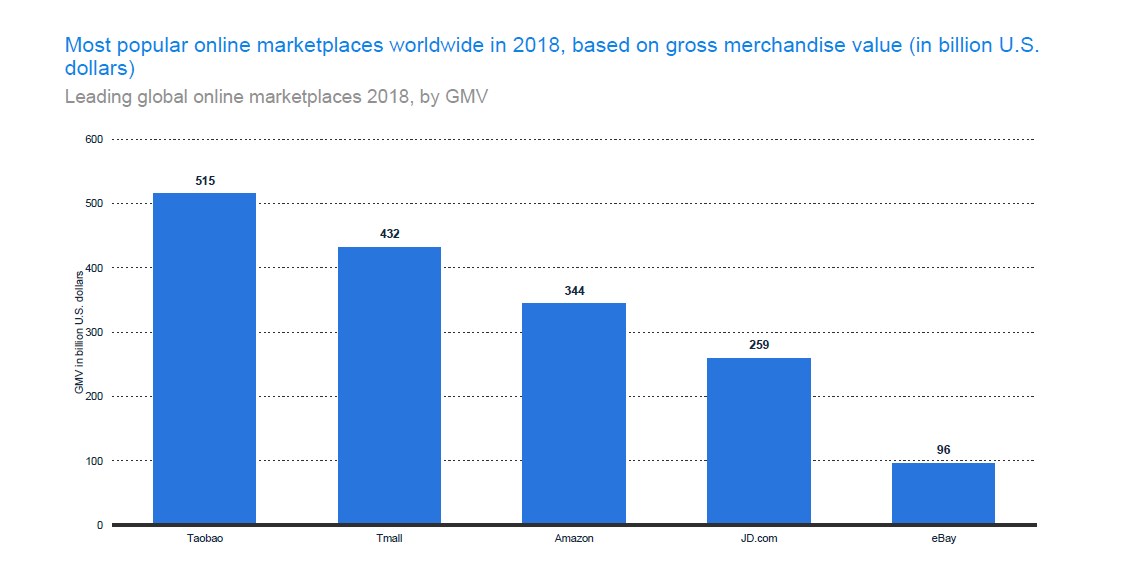
With that said, while Amazon leads in visit share, it comes in 3rd in Gross merchandise value. Its GMV was at $344 billion in 2018. The two top companies were Taobao and Tmall at $515 billion and $ 432 billion, respectively. Wish, and Houzz came in last at $8 billion and $7.9 billion respectively.
19. U.S. Amazon Marketplace Sales 2016-2019
Customers are attracted to a vast range and number of products sold at competitive and low prices. Amazon leads the pack in the above criteria. While it serves different market places, it has its stronghold in the US market.
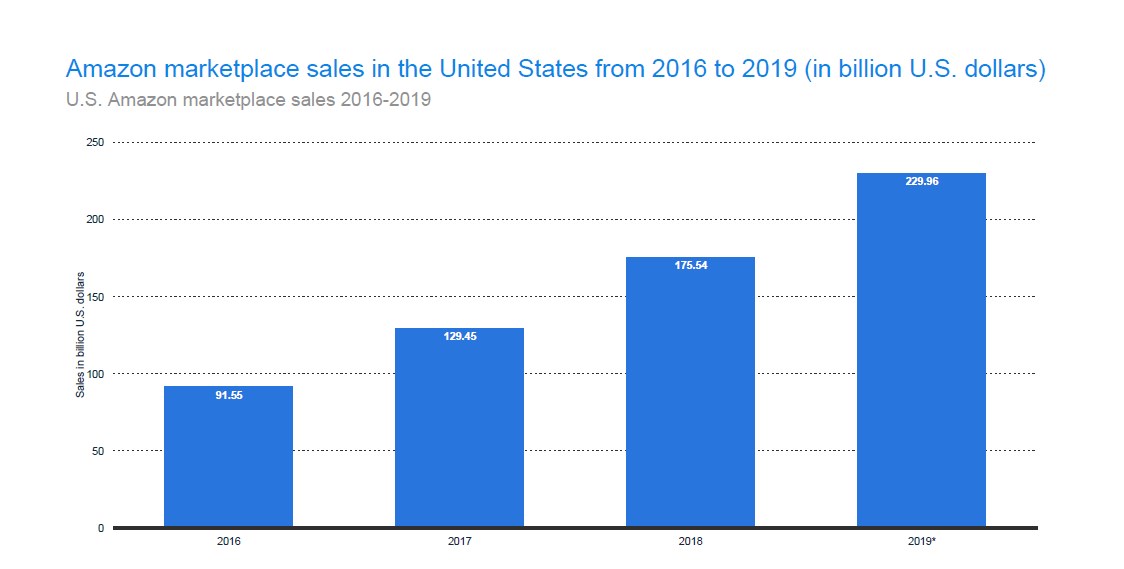
And according to Statista, Amazon’s US sales have been increasing steadily from 2016 through to 2019. The sales went from $ 91.55 billion to $229.96 in 2019.
20. U.S. Amazon Retail E-commerce Sales by Segment
Amazon’s e-commerce sales are split into two; marketplace sales, and direct sales. Direct sales are where Amazon made the sales directly while the marketplace sales refer to the products and services sold through third-party sellers on the platform. In which case, Amazon processes the transactions and gets a cut as the marketplace operator.
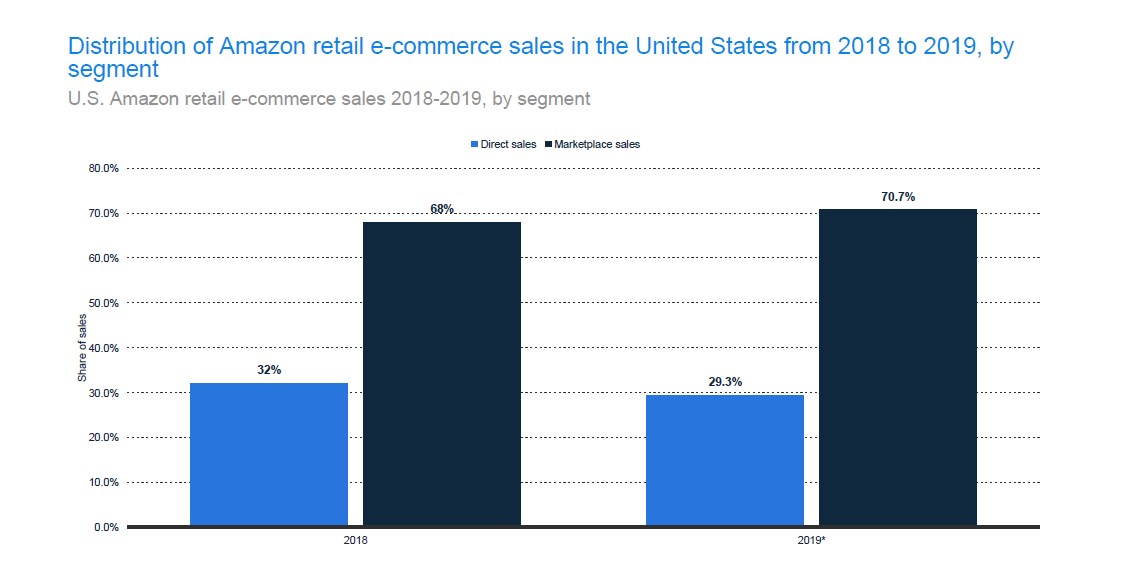
Between the two, Amazon makes more marketplace sales than direct sales. This is reflected in the 2018 and 2019 sales percentage per segment. They are as follows;
- 2018: Direct sales were 32%, and market place sales were 68%
- 2019: Direct sales were 29.3%, and marketplace sales were 70.7%
There was a slight drop in direct sales between the years.
21. Third-party seller share of Amazon platform
In the first quarter of 2019, 53% of all paid units were sold by third-party sellers. In 2018, the percentage was at 52%. There are several ways merchants can sell products on Amazon. This is through 1P (first-party) or 3P (third-party). Through 1P sales, you are required to send your inventory to Amazon. Amazon will control the pricing and include details like sold and shipped by Amazon. As a seller, you don’t get any credit. However, you benefit from wholesale purchases since Amazon buys in bulk, and your products are prioritized.
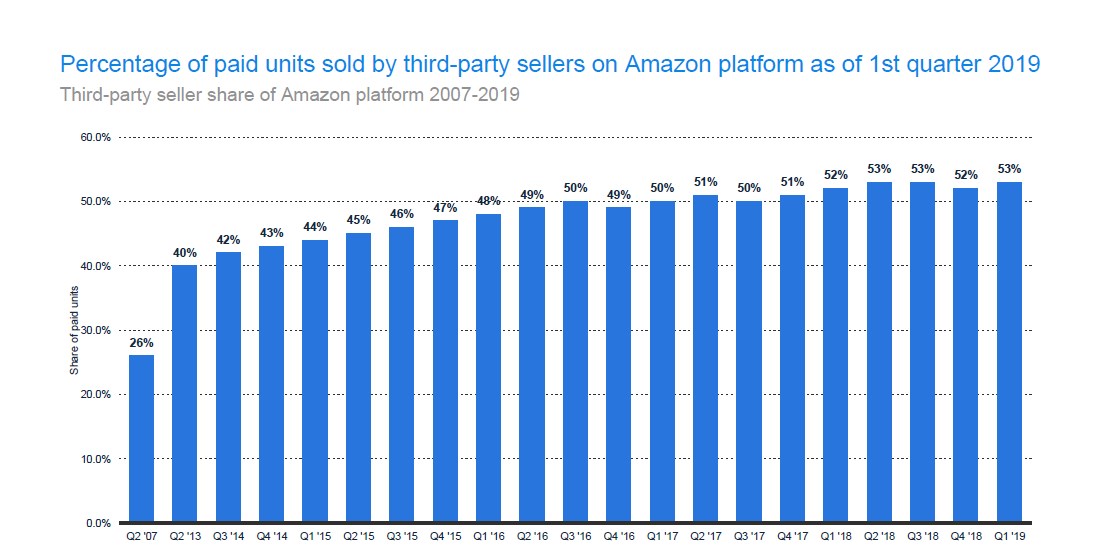
On the other hand, 3P is where you are allowed to sell products on the site and fulfill the orders that come through. Speaking of fulfillment, there are two options; Fulfillment by Amazon and Fulfillment by Merchant. Most sellers prefer 3P selling strategy. Mainly because they can control their price and their business relies less on their relationship with Amazon.
22. SMB Business Volume on Amazon
SMB’s thrive on Amazon because of the business model. Amazon provides small businesses with a platform to showcase and market their products. They get to save costs on marketing and setting up their own sites. Because of this, Amazon has a lot of small and medium-sized business.
But what exactly are SMBs? Well, generally, businesses are measured by the number of employees they have. Small businesses are those that have less than 100 employees, while mid-sized businesses are those with between 100 and 999 employees.
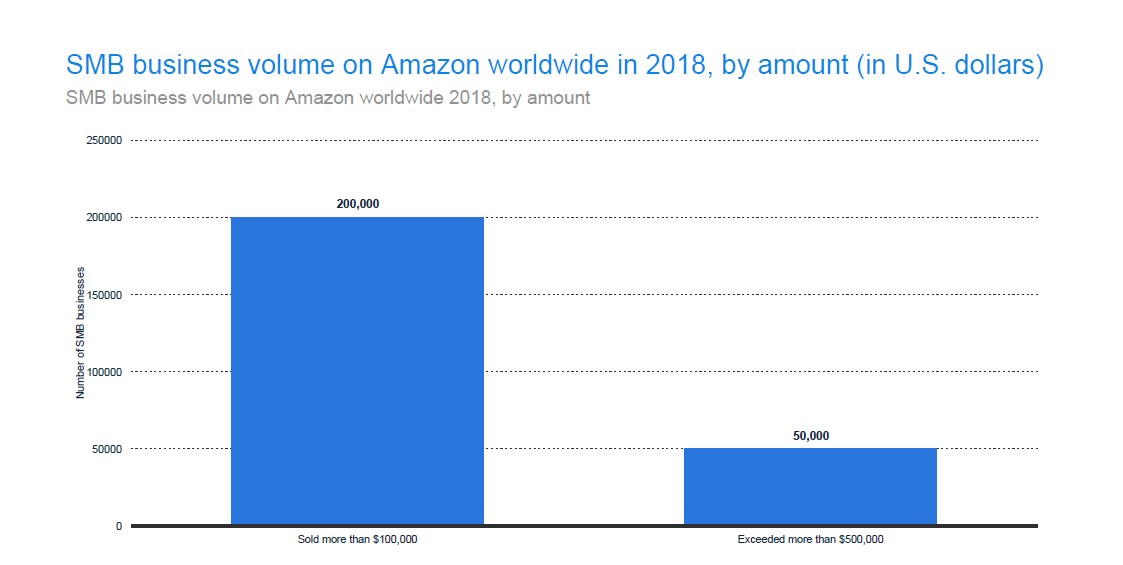
The SMBs on Amazon that sold more than $100,000 were 200,000, and those that sold more than $500,000 were more than 50,000.
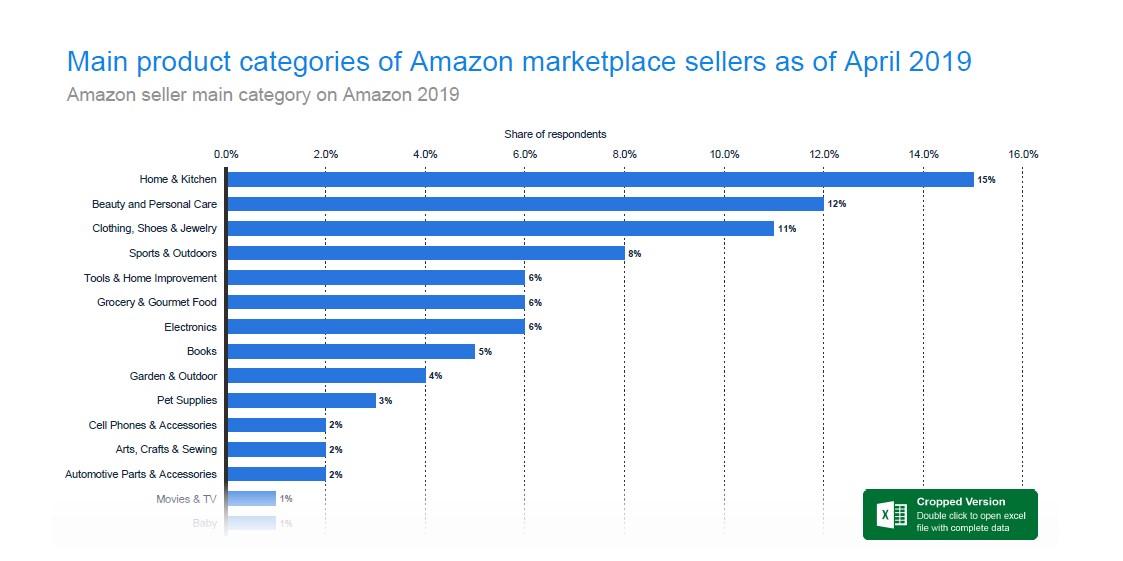
23. Amazon Seller Main Category
Though electronics are by far the most selling category on Amazon, you’ll be shocked to note that it’s not the category Amazon’s marketplace sellers favor. According to a survey by Statista, 15% of the participants stated they sell in the Home and Kitchen category, while 12% sell in the Beauty and Personal Care category. Only 1% stated that they sell in the Movies and TV category.
24. Amazon Seller Other Marketplace Usage
Though Amazon sellers play by the rules set up, they also now not to put all their eggs in one basket. Many sellers on Amazon are on other platforms as well. They do this to diversify their sources of income. This is the beauty of e-commerce; you can sign to multiple e-commerce sites.
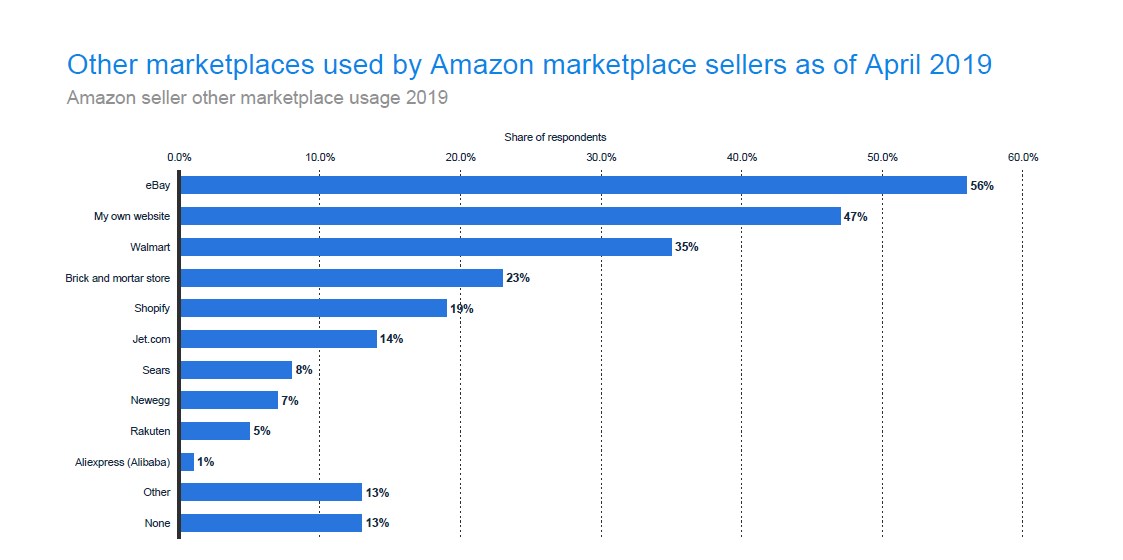
A survey conducted by Statista revealed that 56% of Amazon merchants are on eBay as well, and 47% run their own websites. 23% run a brick and mortar store while 1% are on Alibaba.
25. ACSI – U.S. Customer Satisfaction with Amazon.com (slide 50)
Running an e-commerce site requires a great deal of multitasking to succeed. At times, the multitasking levels may be hard even for skilled entrepreneurs. And while offering great customer satisfaction isn’t the one thing that makes an e-commerce business successful, it certainly is an integral part of success.
With the stiff e-commerce competition, companies like Amazon have realized the benefit of keeping their customer satisfaction levels high. And according to Statista, it’s able to maintain high levels of customer satisfaction probably because they have enough resources to dedicate to customer satisfaction.
Determining customer satisfaction can be challenging. But even then, not even Amazon can afford to have millions of unsatisfied customers. It’s worth noting that customer satisfaction for Amazon and other e-commerce sites is important in both B2B and B2C.
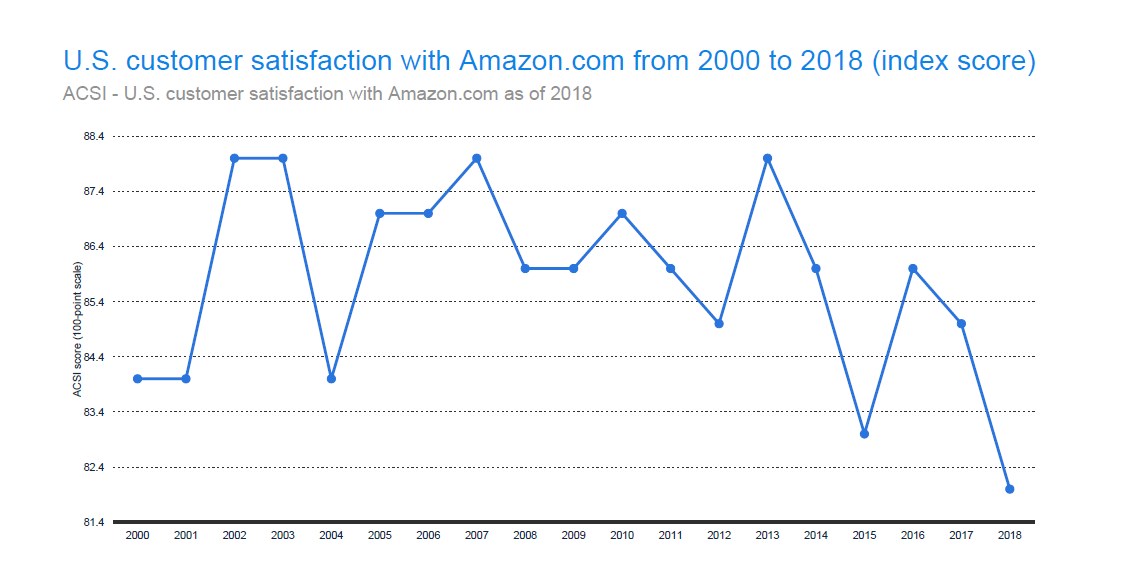
And while there are many ways that companies use to measure customer satisfaction, many opt to use the American Customer Satisfaction Index (ACSI). This company uses data from interviews. ACSI is annual and helps companies vet the quality of services and products available to their customers.
Amazon customer satisfaction over the years has fallen between 81.4 and 88.4. The least score was in 2018, and the best was in 2002, 2004, 2007 and 2013.
How has having a high customer satisfaction rating helped Amazon over the years? Well, the high scores have helped build brand trust, brand buzz, and brand loyalty.
26. US Consumer Usage of Amazon Services
Since its inception, Amazon has been busy building and launching new products. It’s no longer the online bookstore it started as. It currently serves as a full-fledged e-commerce store selling practically anything and everything you’d want. In addition to this, it also has;
- Amazon Video
- Amazon Prime
- Amazon Appstore
- Amazon Music
- Prime Now
- Amazon Payments
- Audible
- Alexa
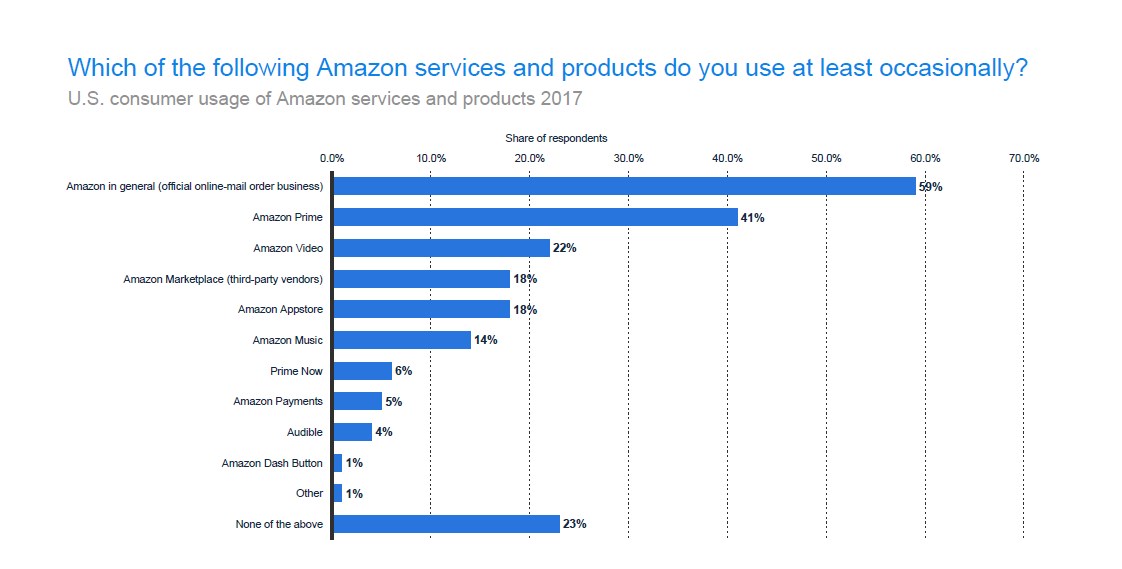
Though all of these products and services are successful, their customer usage varies greatly. Many people use Amazon in General (59%), while 41% of consumers use Amazon Prime.22% use Amazon Video, and 18% use Amazon marketplace. Among the least used include Audible and Amazon Dash Button which comes in at 4% and 1% respectively.
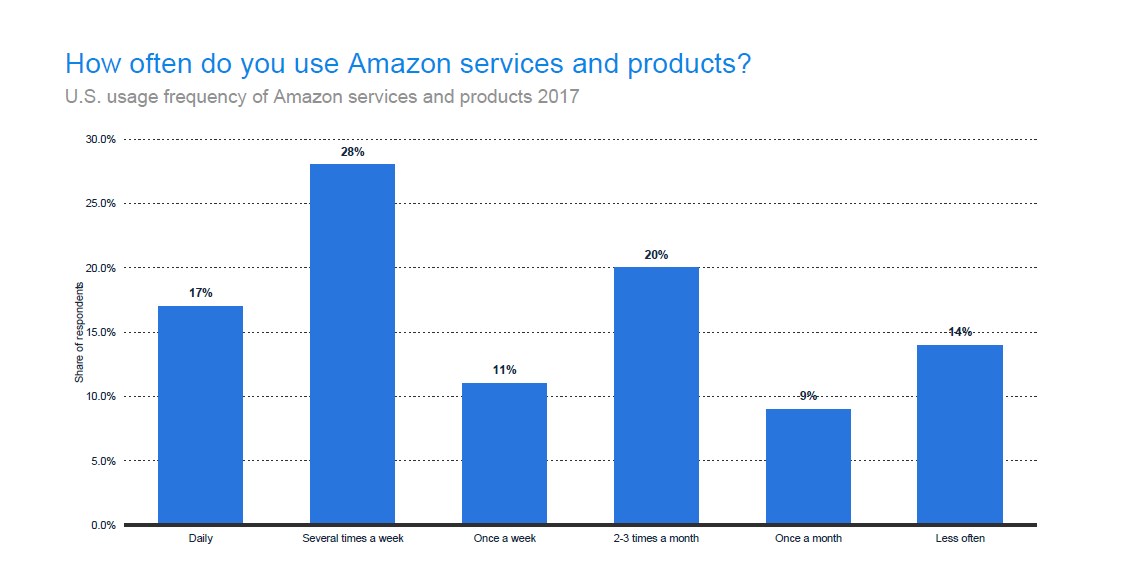
27. How often are Amazon Products and Services Used?
We’ve seen which Amazon services are used most. Now we should look into how often these services are used by consumers. Statista conducted a survey, and 28% of the respondents said they use the services a couple of times weekly. 20% of the respondents claimed to use the services 2-3 times in a month while 17% claimed to use the services daily. Only 14% use it less ‘often.’
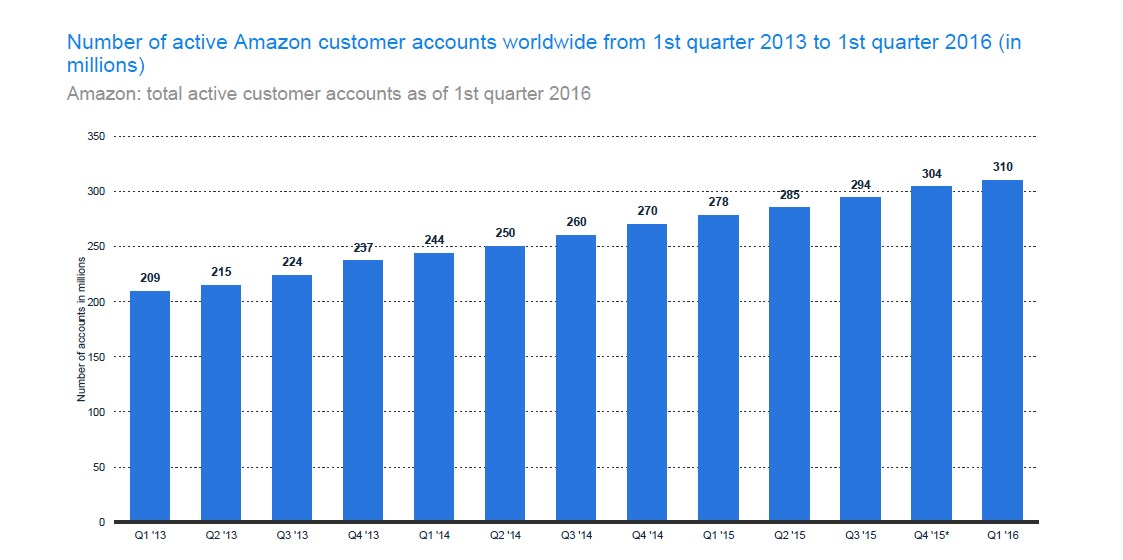
28. Total active Amazon customer accounts as of 1st quarter 2016
Being the number one e-commerce platform in the world, it’s only logical that it has a lot of customers. According to Statista, Amazon had 310 million active users by the last quarter of 2016. The operative word is ‘active.’ The survey doesn’t take into account, passive customers.
The Amazon Prime benefits are the number one reason why Amazon has so many accounts. The revised annual subscription packages are alluring and designed to target persons with low income. For other users, it’s the 2-day free shipping that reels them in. But others still are impressed by the variety of digital services offered, including instant audio and video streaming across multiple platforms and loads of discounts and promotions. For instance, in July of 2015, Amazon ran flash sales for its 20th anniversary. It was a solid marketing stunt that saw a spike in account opening.
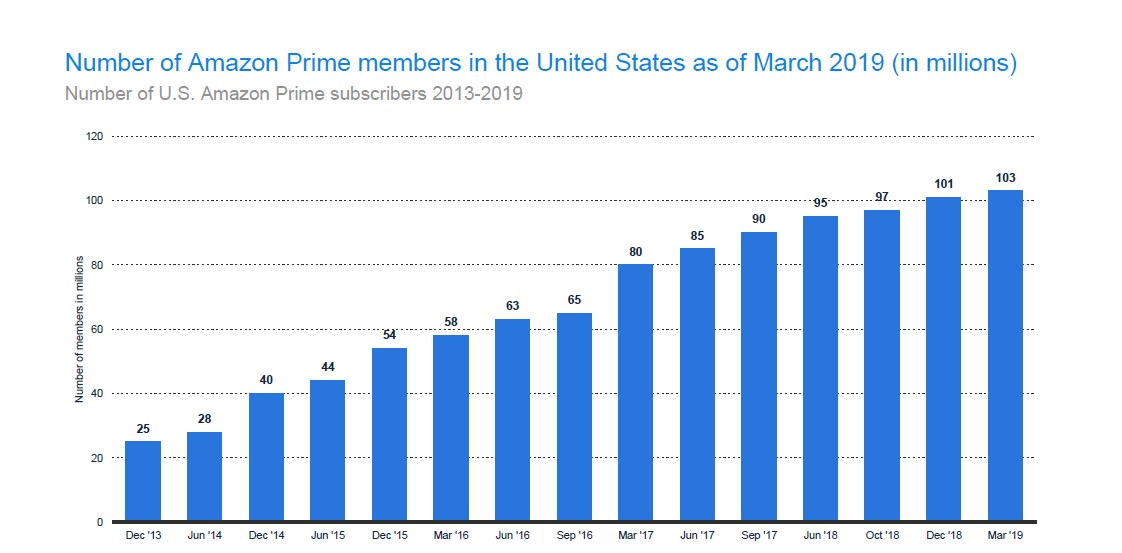
29. Number of U.S. Amazon Prime subscription households
Amazon is not forthcoming with Amazon Prime subscription details. However, according to Statista, by July of 2017, Amazon Prime had 54.2 million users living in a household with an Amazon Prime subscription.
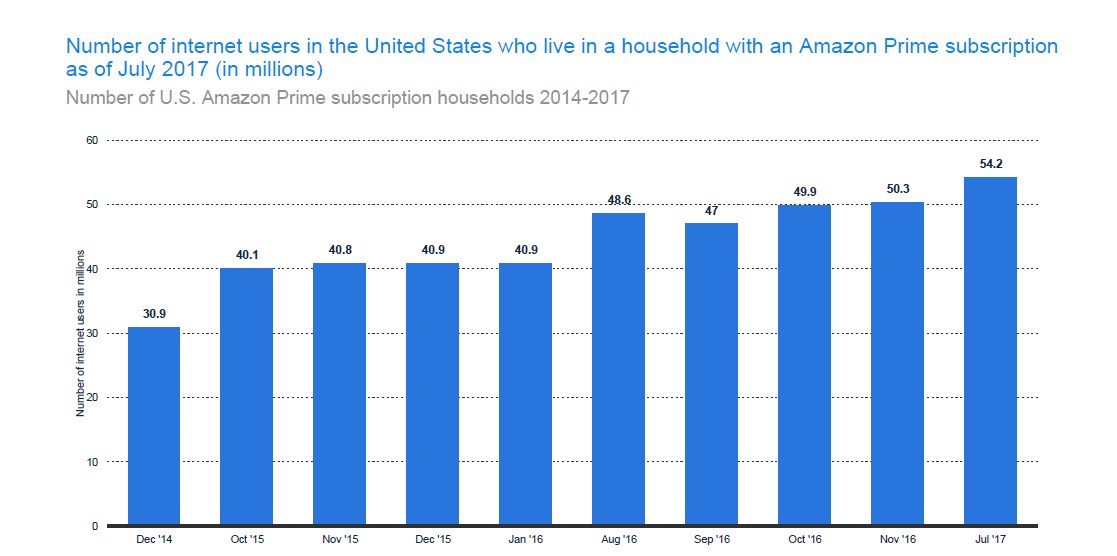
But since 2017, a lot of changes have occurred including a free 2-day shipping and revised annual membership costs. Because of this, the number of Amazon Prime members has shot to 103 million in 2019.
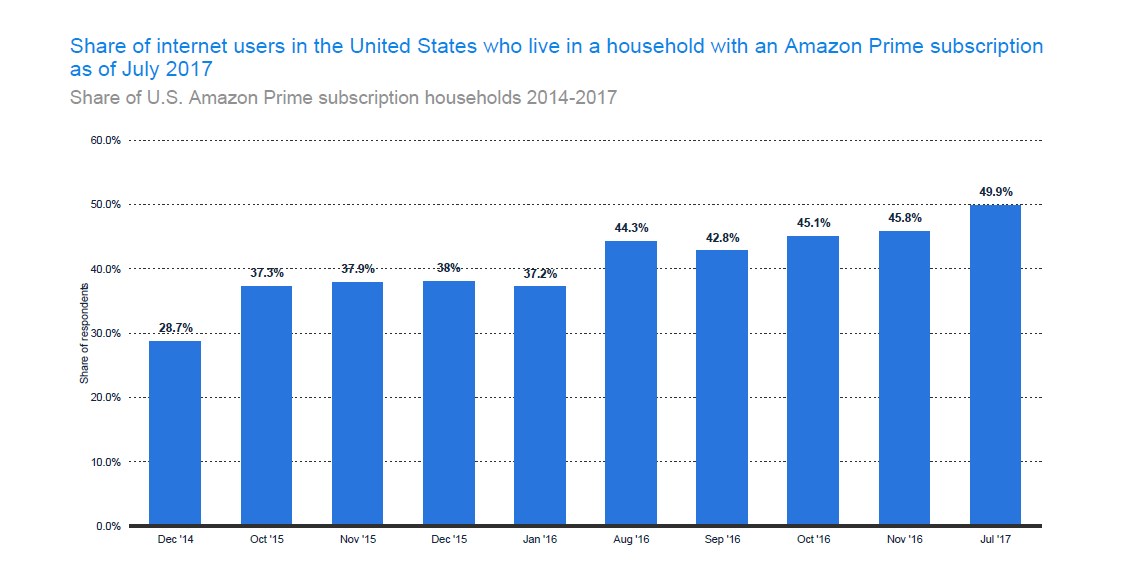
As of 2017, the share of US Amazon Prime Subscriptions was at 49.9%. This was an increase from 28.7% in December 2014. In December 2018, the US share of Amazon Prime subscribers was 62%. It was an increase from 59% in June of 2018.

In terms of households, 63.9 million households in the US have an Amazon Prime membership in 2019. Statista experts predict that this number will grow to 68.7 million households in 2020 and 71.7 million households in 2021.
30. US Amazon Prime Subscription Plan Distribution
According to Statista, in 2017, only 11% of adults had monthly video subscriptions. At the time, the subscription was worth $8.99 a month. Also, 14% of adults are recorded to have a monthly subscription priced at $10.99 a month, and 75% had an annual subscription worth $99 a year.
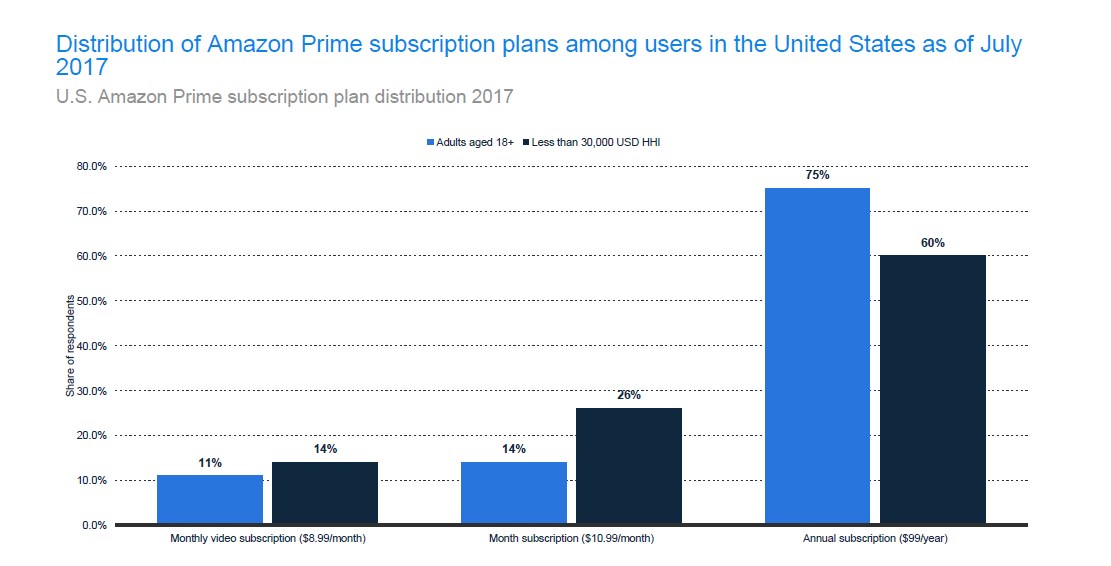
With the annual subscription, users get to save close to $45. As such, it’s understandable why many users would go for that plan.
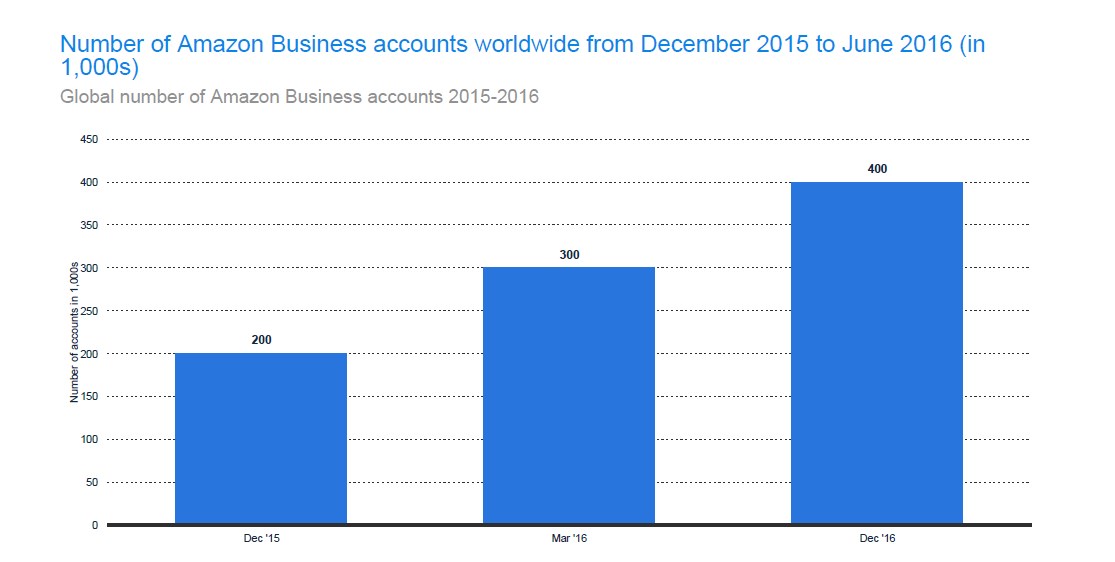
31. Global Number of Amazon Business Accounts
The Amazon Business is simply a version of the Amazon Prime, but one that is tailored to suit businesses. The thing about Amazon Business is that it offers the users with solutions for their businesses.
Every business has the authority to pick users who are allowed to transact on behalf of the business. The transactions include buying supplies on behalf of the employer and customer support. The administrator has the power to add and remove users at will. He can also manage the payments made.
Like Amazon Prime, Amazon Business features free two-day shipping on specific items. Moreover, it has features tailored for businesses, including approval workflow, multiple users, tax exemptions, payment solutions, and customer support. The best thing is that Amazon Business doesn’t cost anything extra if you are a single user. However, for shipping, you’ll incur a cost based on the number of users allowed on the business account. For a maximum of 10 users, the cost is $499.
Additional perks of the business account include;
- Analytics board
- Order tracking
- Amazon business customer support
- Purchasing approval
- Amazon corporate credit line
- Business only pricing
- Business only selection
Now that you are familiar with the Amazon Business account, let’s get into the stats. According to Statista, by December 2016, there were 400,000 Amazon Business accounts opened. This was an increase from March 2016 and December 2015 a time when there were 300,000 and 200,000 accounts, respectively.
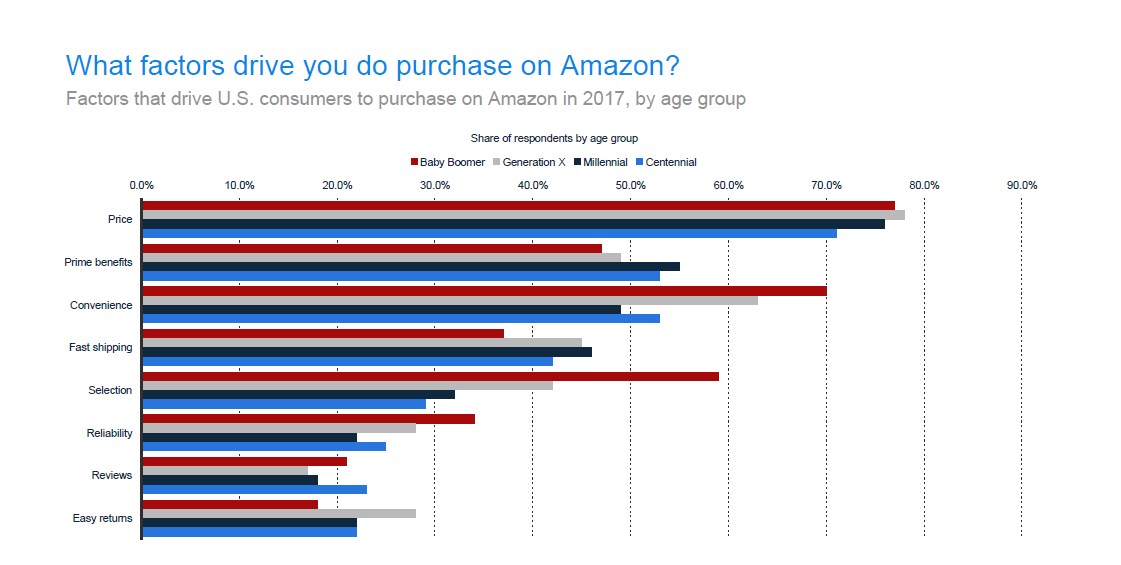
32. Key factors for U.S. users to shop via Amazon 2019
With so many sellers on Amazon, competition is stiff. Because of this, it’s important for Amazon sellers to understand what factors affect the purchasing decisions of Amazon buyers.
According to a survey conducted by Statista, 82% of Amazon users consider price before they purchase. With the many discounts and promotions that sellers run, this is expected. The other factors that buyers consider include low shipping costs (since this can increase product cost exponentially) and positive product reviews.
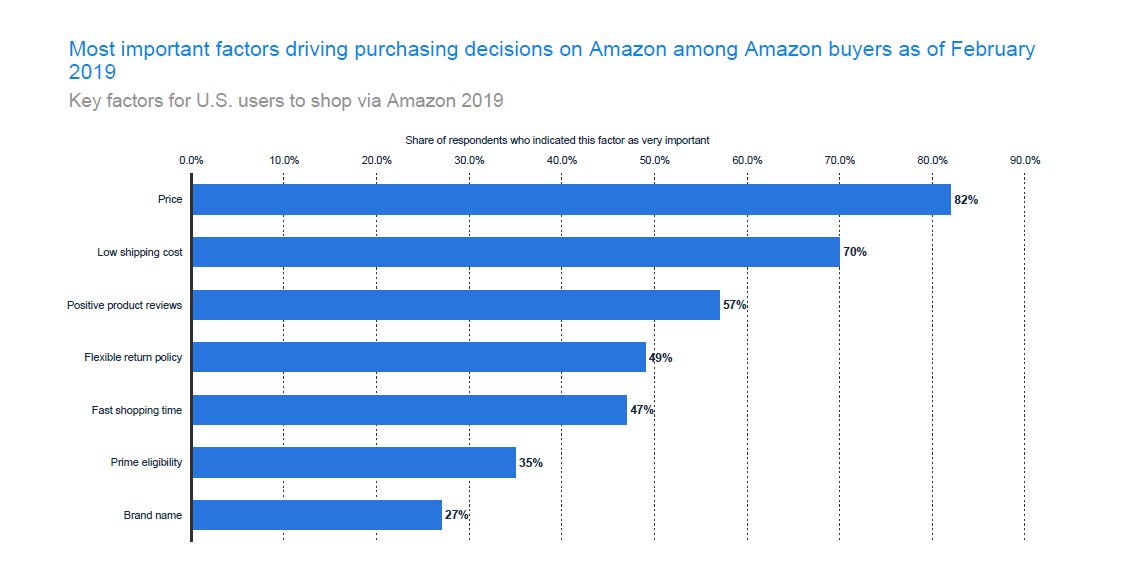
When buying a product online, buyers don’t have the luxury of touching, smelling, or trying the products. As such, to ensure that they buy a quality product that meets the expectations stated, 57% of buyers rely on positive product reviews to make a decision.
Aside from the above, 49% consider flexible return policies, 47% factored in fast shipping time, and 35% took into account Prime eligibility. Very few buyers (27%) considered the brand name during their purchase. And because of this, small businesses have a chance to grow and thrive on Amazon.
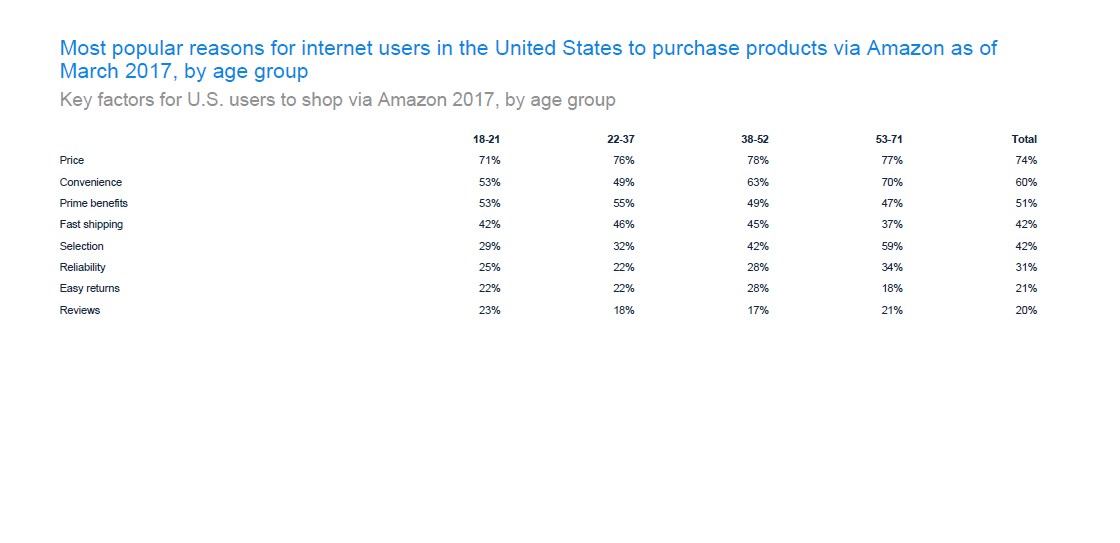
It’s also worth pointing out that 78% of buyers aged between 38 and 52 thought price was an important factor to consider before making a purchase, young buyers ages 18-21 years not so much. On the other hand, 70% of users aged between 53 and 71 considered the convenience of making the purchase. However, 23% of young consumers were concerned with positive reviews than buyers in older age groups.
33. Online shopping and buying-related activities by U.S. internet users
The world has gone digital. And while all people of different age groups have embraced technology, some have been absorbed into it more than others. Youngsters are reported to be more active online than other users. Here are some stats that back up this claim.
According to Statista, 55.8% of users aged between 18 and 29 years did substantial research before committing to a purchase in-store. Additionally, 50% of this age group made their purchase on online marketplaces like Amazon.
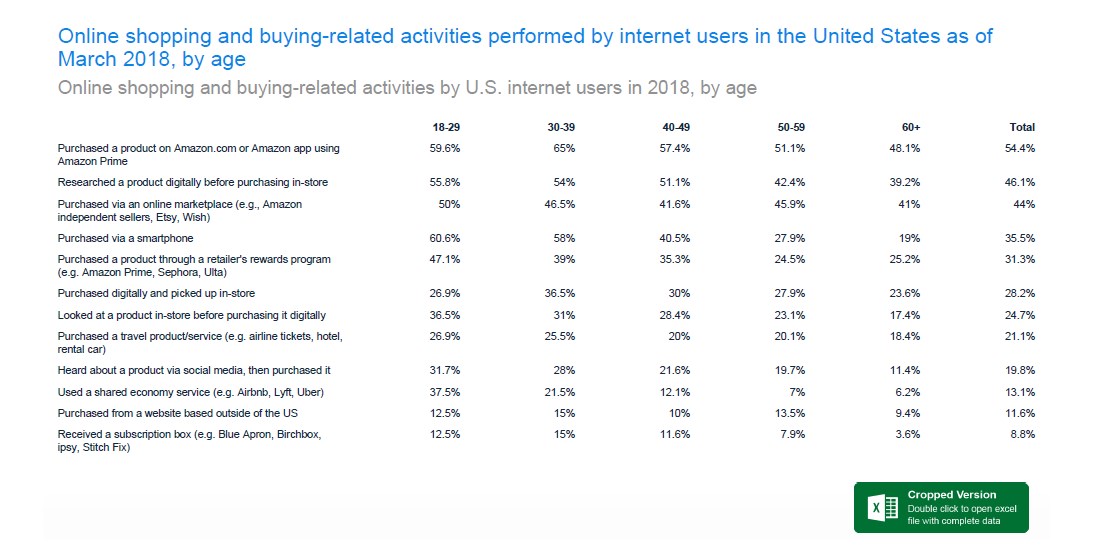
Also, according to data collected, users aged between 30 and 39 years purchased products through reward programs like Amazon Prime and Ulita. They also are the most likely users to purchase subscription boxes.
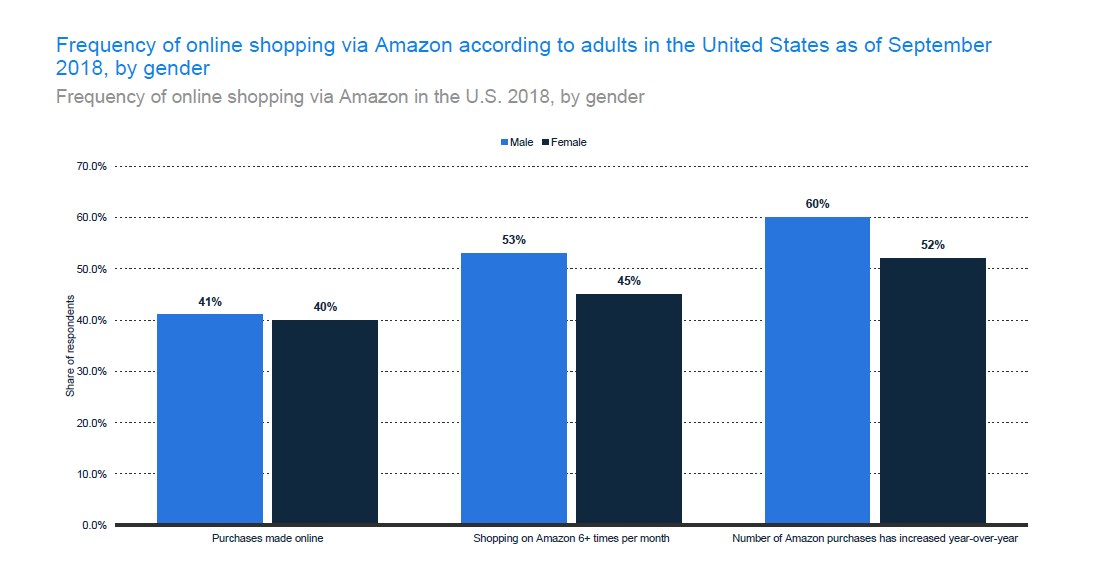
34. Frequency of online shopping through Amazon by Gender
Amazon has male and female buyers and sellers.
And while one might think that women shop more online than men, statistics prove otherwise. According to Statista, 41% of males vs. 40% of females bought items online in 2018. Additionally, 53% of men shop 6 or more times a month online, while only 45% of females do. And lastly, 60% of males state that the number of purchases made online increases over the years, while only 52% of women confess the same.
35. Types of devices used by US online shoppers for Amazon shopping
Technology has made it possible to access Amazon through a variety of gadgets. Different gadgets offer different convenience levels and are preferred by different buyers. The most common devices used include PCs and desktops, smartphones, tablets, and voice-enabled devices like Echo.
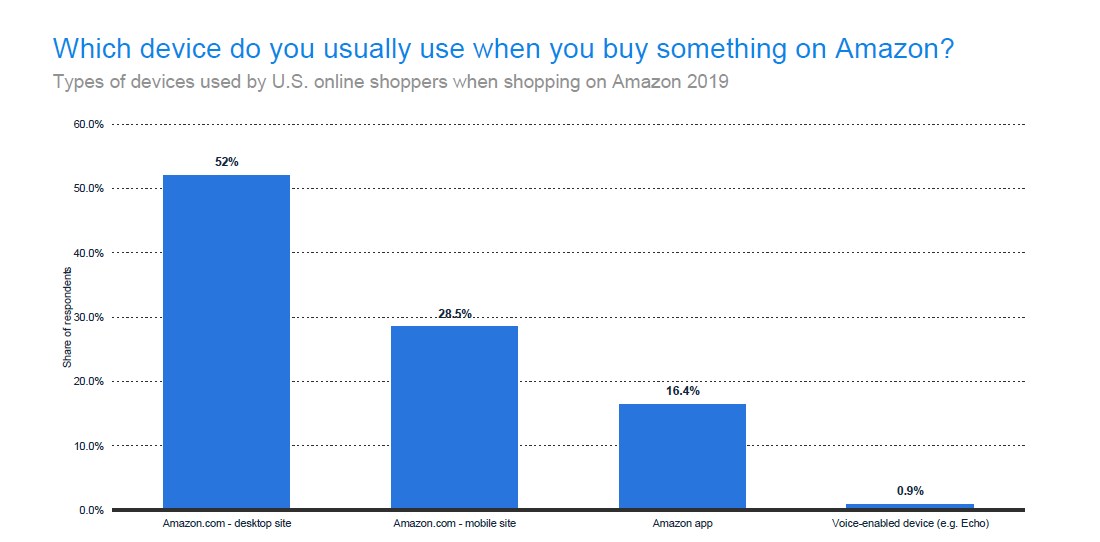
According to Statista, 52% of online shoppers use the desktop site, while 28.5% use the mobile site. Lastly, only a meager 0.9% use voice-enabled devices, including Echo.
36. US online shoppers who discover new brands and products on Amazon
Amazon has more than 606 million products as of 2007. The number has since increased exponentially. To make it easier to find the items you need, Amazon has categorized the items. Moreover, they have a search bar which uses keywords to present users with the products they are looking for.
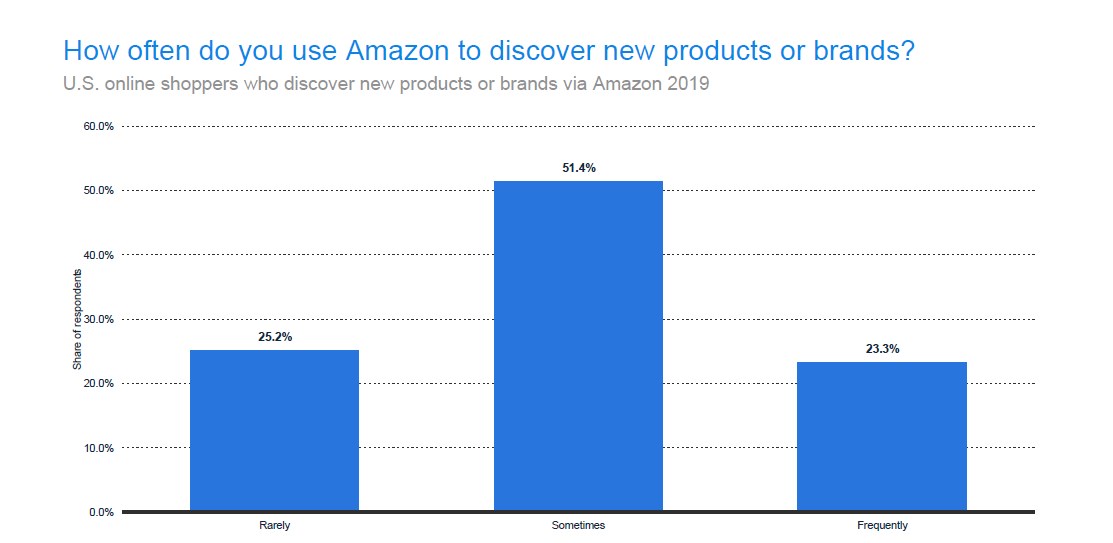
And while many users often know what they are looking for on the platform, from time to time, they are bound to discover a new product and technology. But how often does this happen? With more than 606 million products you’d think quite often, right? Well, it doesn’t happen a lot. According to Statista, 25.2% of users rarely discover new products, services, and technologies. 51.4% and 23.3% admitted that they sometimes and frequently (respectively) come across new tech, services, and products.
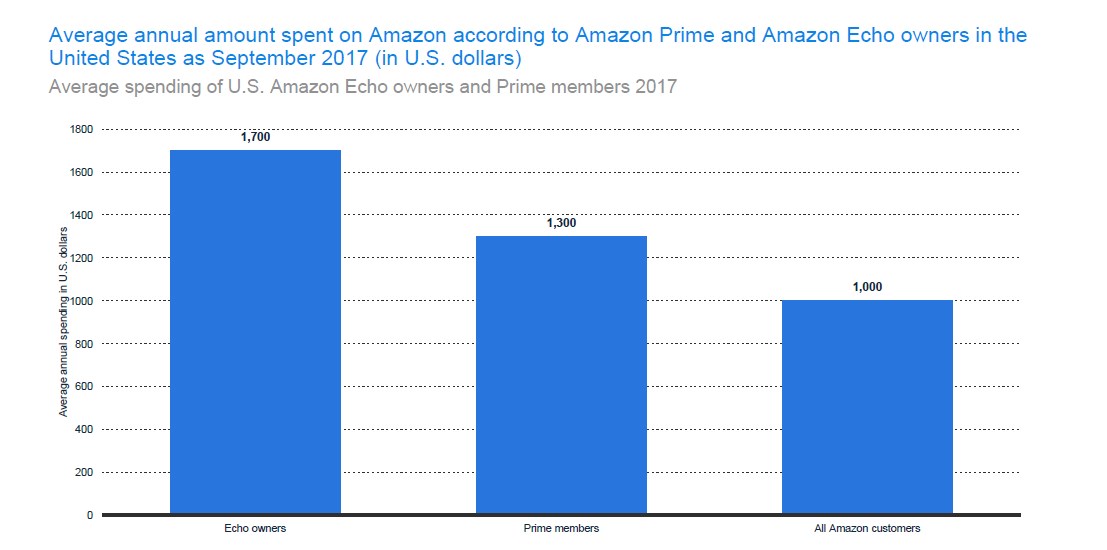
37. Average Expenditure of Amazon Prime and Non-Prime Members
Though Amazon tries to keep a tight lead on the numbers related to Amazon Prime membership, Statista managed to get something. According to Statista, Amazon Prime members usually spend a little more than non-prime members. Prime members in March of 2019 spent about an average of $1,400 while non-prime members spent about $600. These figures have been relatively steady since June of 2018.
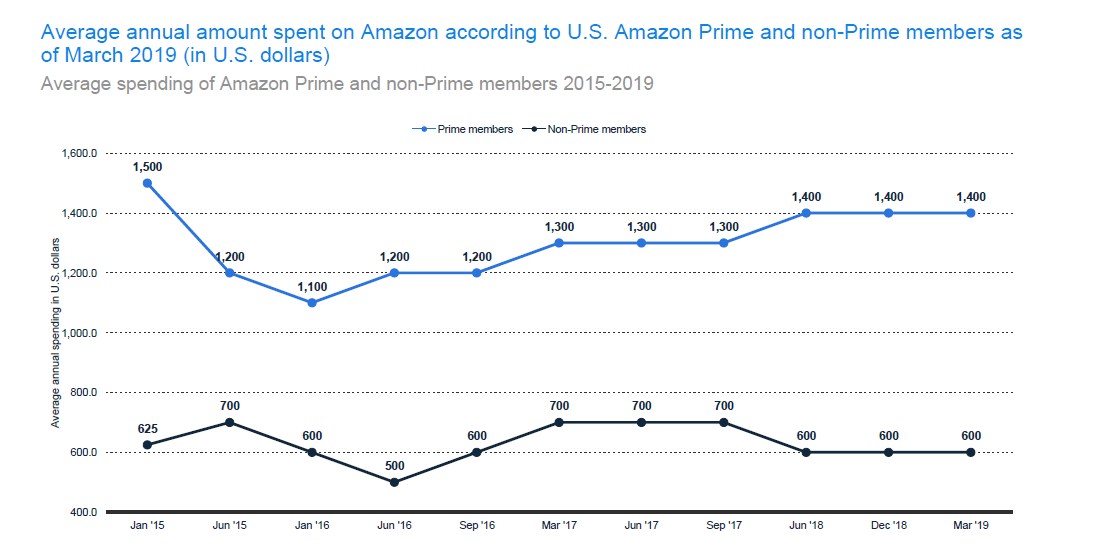
In 2017, the expenditure was at 700 for non-Prime members and $1300 for Prime Members. Additionally, Statista noted that in September of 2017, Echo owners spent a little more than all other Amazon members – they spent an average of $1,700.
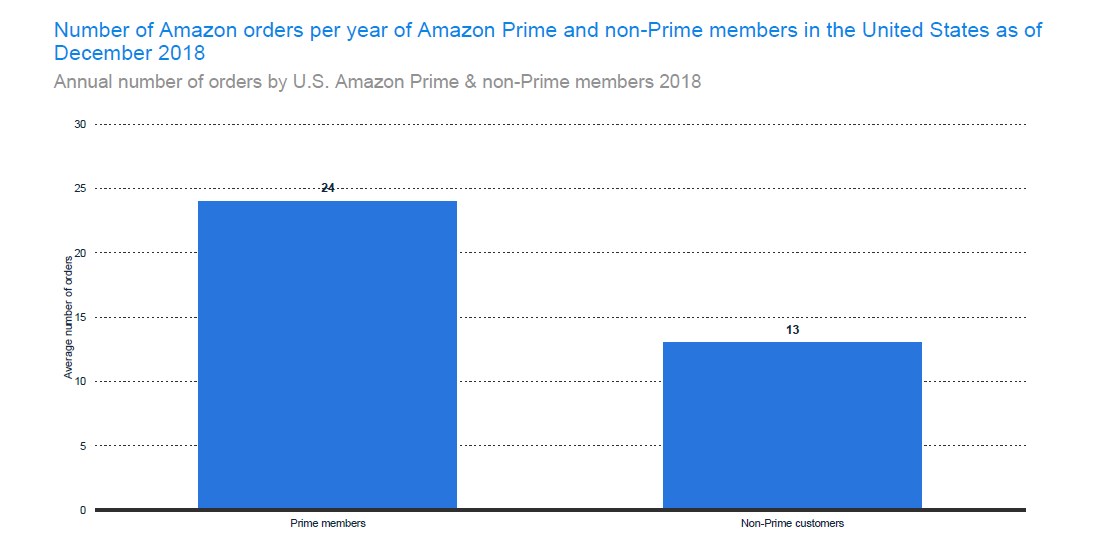
38. The annual number of orders by Amazon Prime and non-Prime Members in the US
The above average expenditures translate to 24 annual orders for Prime members and 13 orders for non-Prime members in 2018, according to Statista.
39. Amazon’s delivery speed expectations fulfillment
The beauty of shopping online is that users get great prices and its convenience. But on the flip side, a product can take ages before it gets to you. Because of this, users are cautious with the delivery/fulfillment times. You don’t want to wait for more than a week to receive a product in the US.
Amazon is aware of this and as such works hard to ensure it meets the fulfillment expectations.
The product would better arrive before the date quoted than later. It’s all about under-promising and over-delivering. In comparison to other e-commerce sites, Amazon does a great job of keeping its consumers happy in this regard.
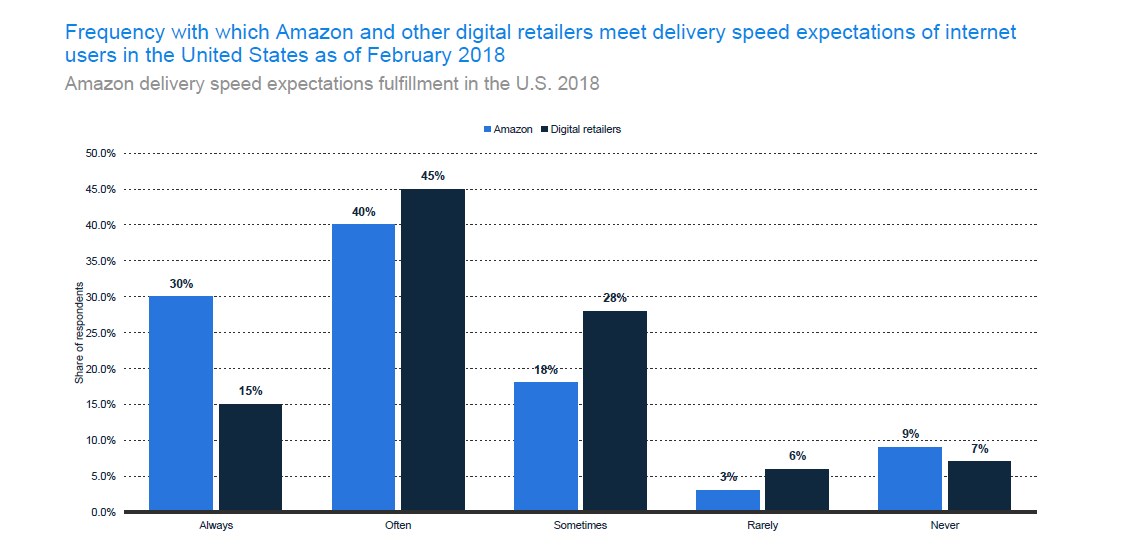
According to Statista, 30% of respondents agree that Amazon meets their fulfillment expectations always, while other e-commerce sites are backed by only 15% of the respondents who claim that they always meet their expectations.
Only 9% of the respondents stated that Amazon never met fulfillment expectations. This is high in comparison to other e-commerce sites’ 7% vote of never meeting speed fulfillment expectations.
40. U.S. Amazon Prime service subscription reasons 2018
Believe it or not, the shows and movies available through Amazon’s video services is not the biggest draw of members to Amazon Prime. Shocking, right? Well, according to Statista, 79% of Amazon Prime members signed up because of their free shipping. Only 11% subscribed to the service because of Prime video and only 10% joined because of Prime Photos, Music, Twitch, Reading and other benefits.
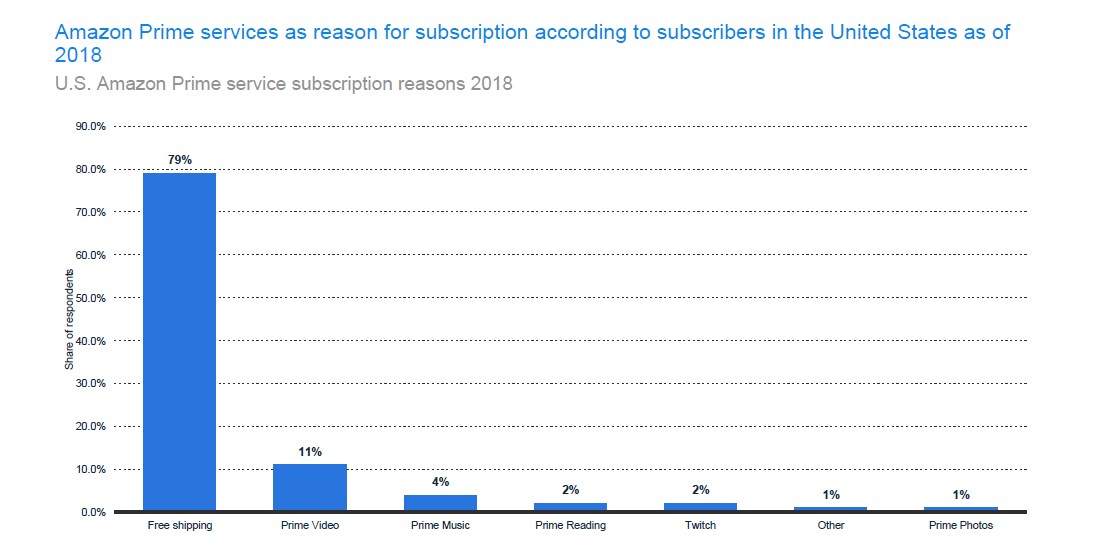
According to Michael Greeson, the director and president of research at The Diffusion Group, Amazon Prime is growing a large following and audience in music, video, and gaming. However, it’s the free shipping that hooks many – it’s the real value of the service.
41. Number of Amazon Prime Video Users
Though the Amazon Prime Video isn’t the main attraction for Amazon Prime and it’s only cited by 11% of Amazon Prime users as the reason for them signing up to the service, their number is still significant.
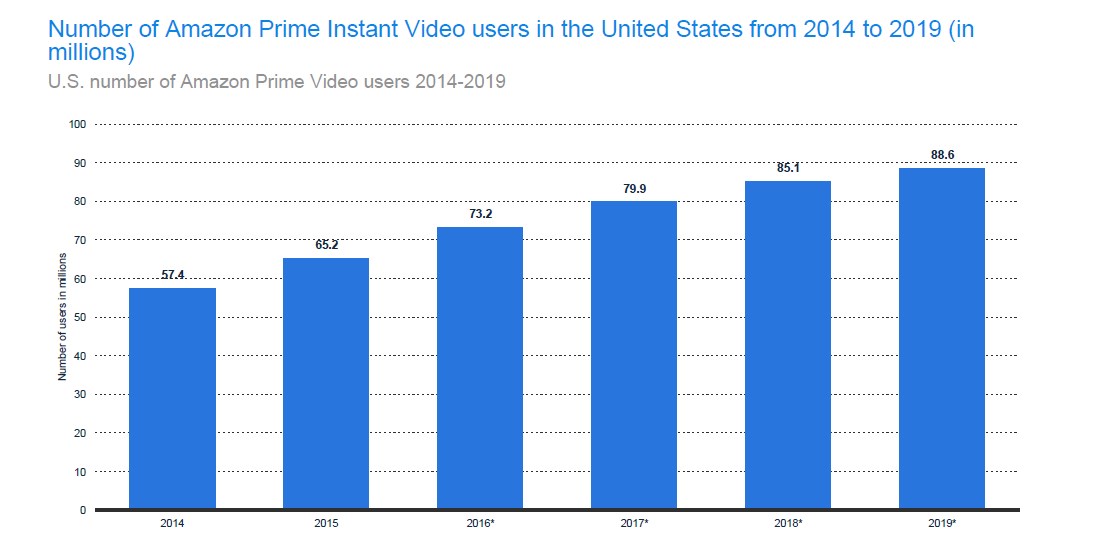
In the US alone, Amazon Prime Video users are expected to hit a phenomenal 88.6 million. This is an increase from 2018’s number of 85.1 million. It’s also worth noting that the numbers have grown steadily since 2014 when the users were 57.4 million.
42. Number of Amazon Video subscribers 2022, by country
We’ve said it multiple times in this piece. Despite being a worldwide service, The US and North America are Amazon’s biggest market. Because of this, you expect a large percentage of users to be from these countries. The same is true with Amazon Prime Video subscribers.
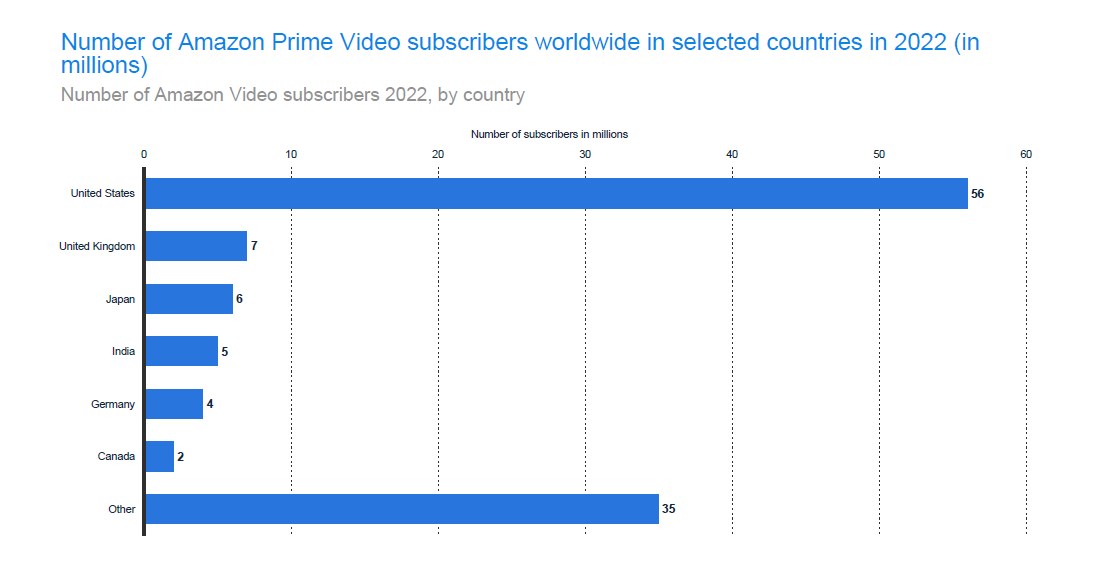
According to Statista, Amazon Prime Video is expected to have a whopping 56 million users in the US alone by 2022. The closest country would be the UK with 7 million, which will be followed closely by Japan, India, German and Canada with 7, 6, 5, and 4 million respectively.
43. Share of Adults with an Amazon Prime Instant Video Account
Now, let’s break things down further. How many adults have access to an Amazon Prime Instant Video Account? In number form, you’d be tempted to think they are many. And while they are, the said number fade away when you look at it from a bigger perspective. Think of how many adults are in the US and then compare that number to those that have Amazon Prime Instant Video Account. Suddenly the numbers aren’t as impressive.
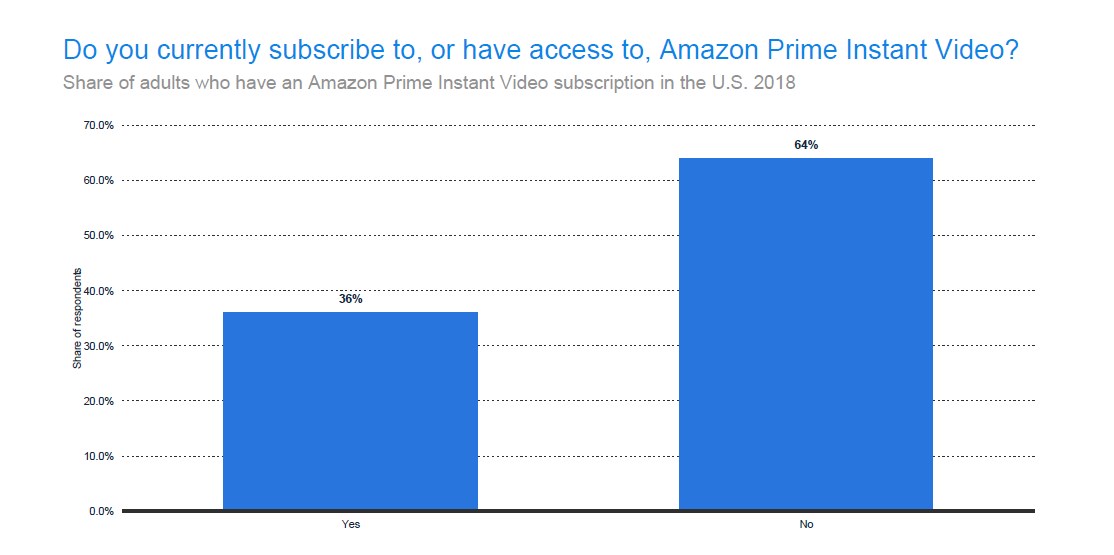
According to Statista, about 36% of adults in the US answered yes to having an Amazon Prime Instant Video Account during a survey. 64% of the adults in the study admitted to not having an account. So while Amazon Prime Video user base has grown and continues to do so every year, there’s clearly a lot of room left for growth.
Additionally, Statista took the survey a little further and broke it down to age. While it’s true that the younger generation has more accounts on the platforms than the older generation, one has to wonder, how many adults below the age of 30 have an account with Amazon Prime Video?
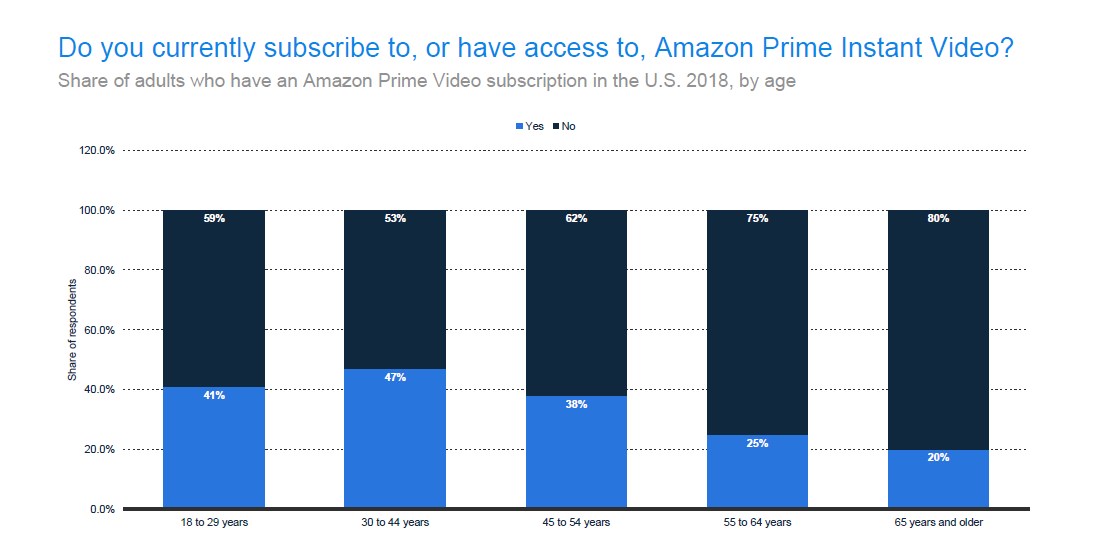
The survey showed that 41% of adults below 30 years have an Amazon Prime account. And only 47% aged between 30 and 44 years have an account. Only 45% of adults above 55 years have an account with Netflix. But then again, this is expected. Many of these older folks don’t have the patience or interest to binge-watch a TV series anyway. And maybe, just maybe, some aren’t aware the service exists.
44. Share of People Using Streaming Services in the US
While we are vocal about Amazon and its services in this piece, it’s no secret that there is a myriad of other services available in the world. Some of which have a wider reach than Amazon Prime Music and Video. These services include Spotify, YouTube for Music, Google Play Music, SoundCloud, Apple Music, and Deezer.
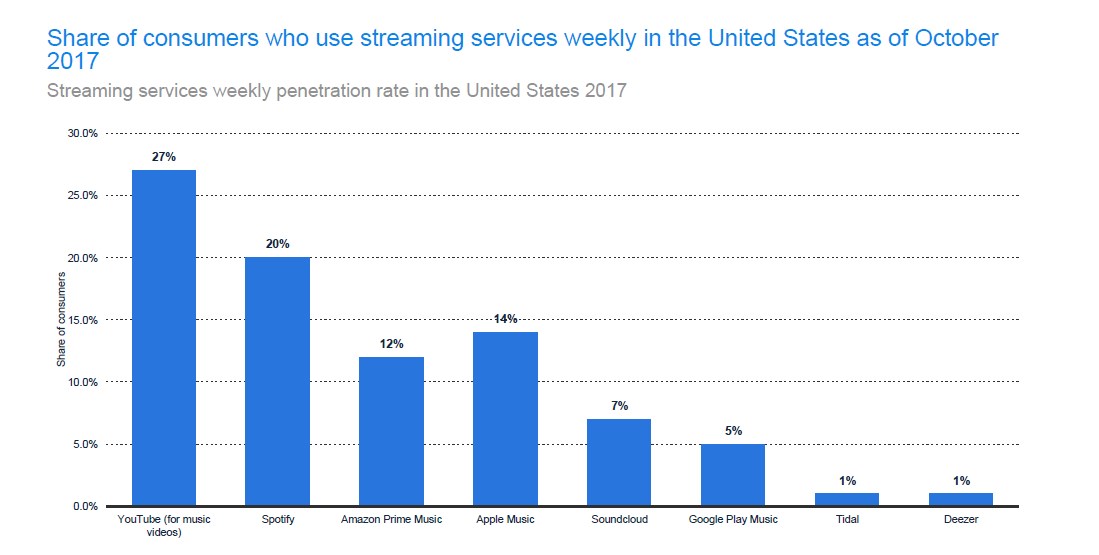
You are familiar with these, right? So you can try and guess the usage share they have every week in the US. While you take a moment, here are some statistics from Statista. YouTube for Videos and Music is the leading, most used streaming service in the US. It has a usage share of 27%. Spotify comes in second at 20%, followed by Apple Music at 14% and then Amazon Prime Music at 12%. The other streaming services share 14%.
45. U.S. Consumer Spending on Digital Media at Amazon (slide 84)
The numbers are great and all, but how much does Amazon make from these users? How many users actually spend money on digital media? With all the free download sites and peer sharing, this is a valid question.
Statista conducted a survey in 2017 and came up with statistics. The statistics shared showed the range of money spent and the digital media that users spend a lot of money on. According to their findings, many users didn’t spend money on Amazon digital media that include e-books/e-papers, digital movies and TV series, digital music, digital games, and digital audiobooks in 2017.
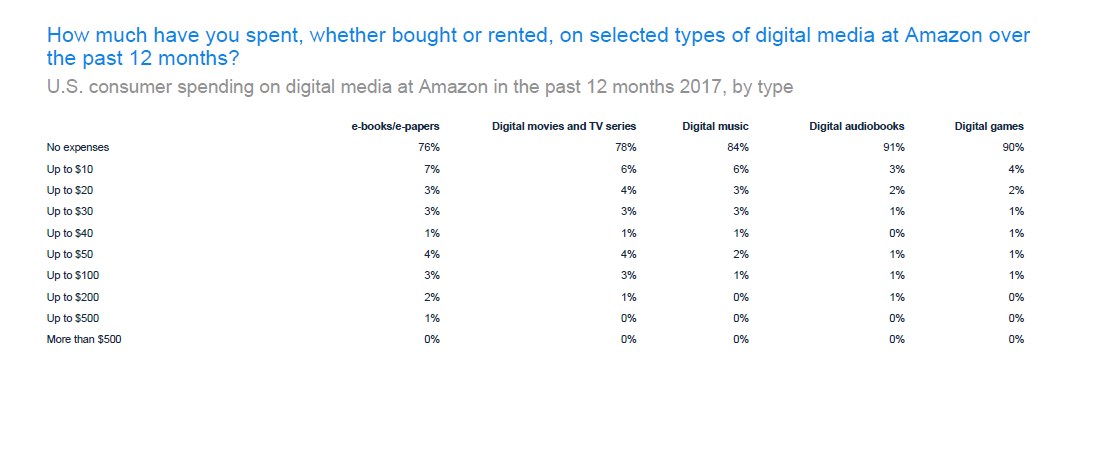
More than 70% of Amazon users didn’t spend any money on these products in 2017. And in the case of digital games and audiobooks, the numbers were as high as 90% and 91%. Aside from this, Statista also found out that a majority of those who spend money on Amazon digital media spent less than $10. Very few persons less than 5% and in some cases even 1% spent more than $100 on Amazon’s digital media.
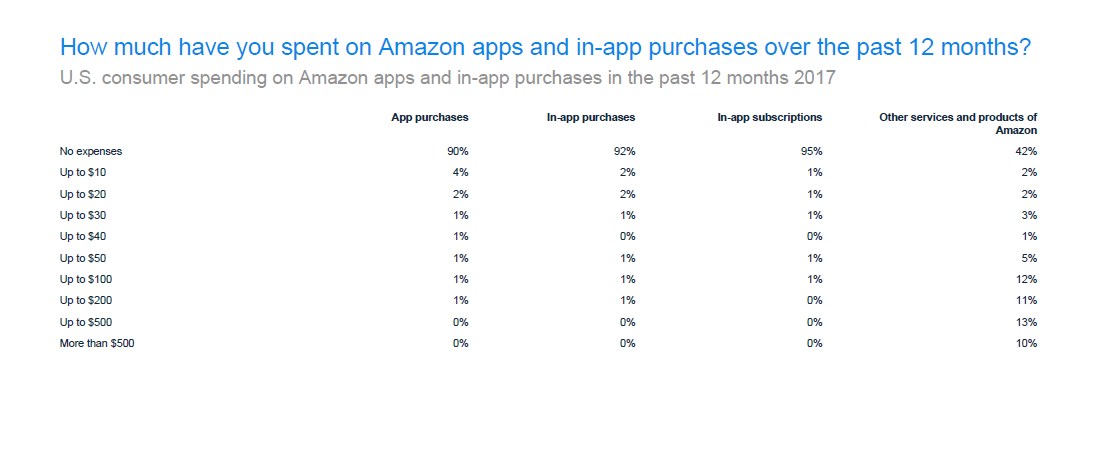
46. US Consumer Spending on Amazon Apps and In-Apps in 2017
Many US consumers also don’t spend a lot on Amazon Apps and In-Apps. According to Statista, more than 90% of consumers spend nothing. And for those that spend, 4% aren’t willing to spend anything more than $10 on App purchases. Quite shocking, right? But before you start feeling sorry for Amazon, remember how much the company makes in profits. If you factor in the number of users that the 10% that spend money represents, the money adds up to billions.
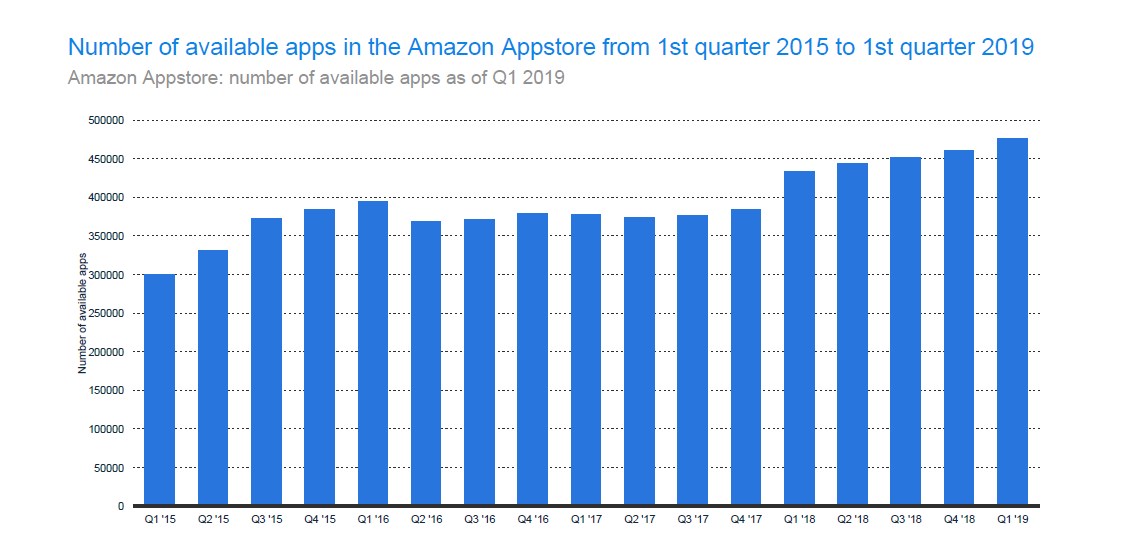
47. How Many Apps are in the Amazon Appstore?
The Amazon Appstore is an app store that’s designed for the Android O.S. However, it is operated and owned by Amazon.com. The Appstore was launched in March 2011 and was availed to more than 200 countries. Developers who contribute to the Appstore get 70% of the app price or from any in-app purchase made.
In September of the same year, Amazon unveiled the Kindle Fire Tablet. This tablet was designed to help Amazon consumers to use products in the Amazon ecosystem. The Kindle is dependent on the Amazon Appstore for applications. Along with the launch of the Kindle Tablet Fire was a fresh Appstore design that was meant to integrate better with the Kindle’s interface.
In June of 2014, Blackberry officially entered a partnership with Amazon. The partnership included providing Blackberry users with access to the Amazon Appstore on the Blackberry 10.3.
When the Amazon Appstore was launched, there was a Free App of the Day feature which was designed to allow users to try out games for free with the hope that they would buy it once the offer elapsed. Every day there was an app on promotion.
During the official launch, Angry Birds Rio was free. And when the app was launched in Europe, Angry Birds (the Ad-Free version) was up for a test drive. However, this feature was discontinued in 2015. Partly because developers felt it was a waste on their part and partly because too many companies were using the business model, thus making it obsolete.
During the launch in March of 2011, Amazon Appstore had only 380 apps. However, by June of 2013, the app numbers had almost tripled. In 2015, the store had about 334,000 applications. By the first quarter of 2019, Amazon Appstore had a whopping 475,617 applications in its database.
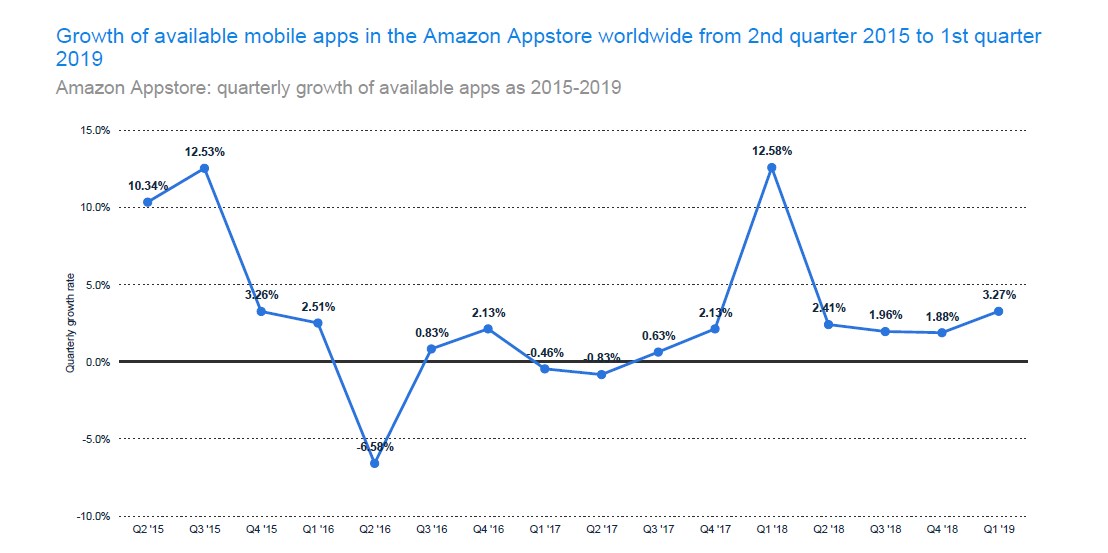
48. Amazon Appstore Growth
The Amazon Appstore growth curve hasn’t been steady. According to Statista, the Appstore growth has been fluctuating with the fastest growth being experienced between the 4th quarter in 2017 and the 1st quarter in 2018. During this period, there was a 12.58% growth rate.
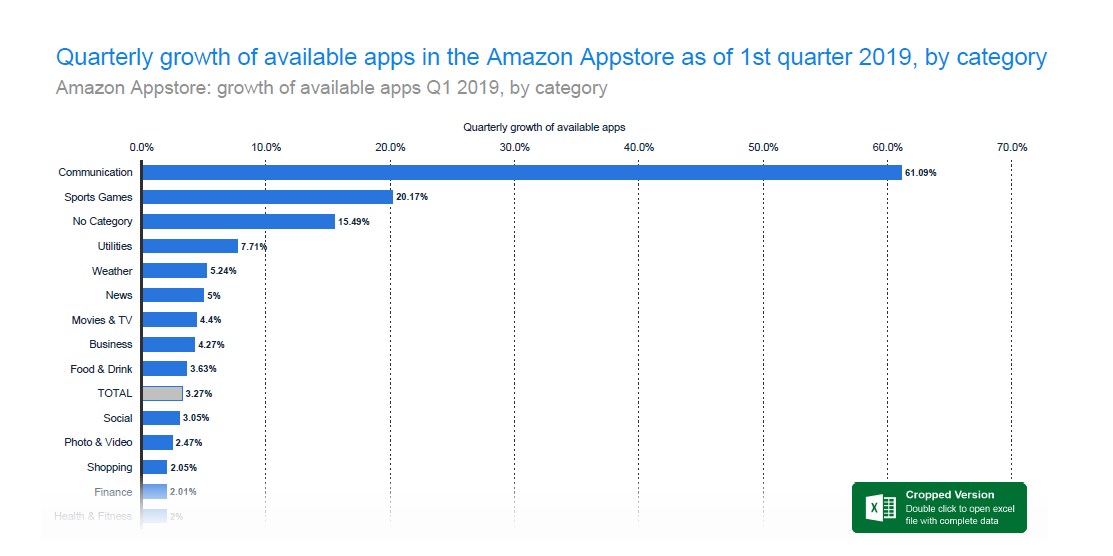
49. Amazon Appstore App Growth by Category
As with other App stores, there are a bunch of app categories that seem to do well than others. In the Amazon Appstore, the communication app category is soaring high. According to Statista, this category had 61.09% growth rate. The category that follows it closely is Sports and Games with 20.17%. Shopping and finance categories had 2.05% and 2.01% respectively.
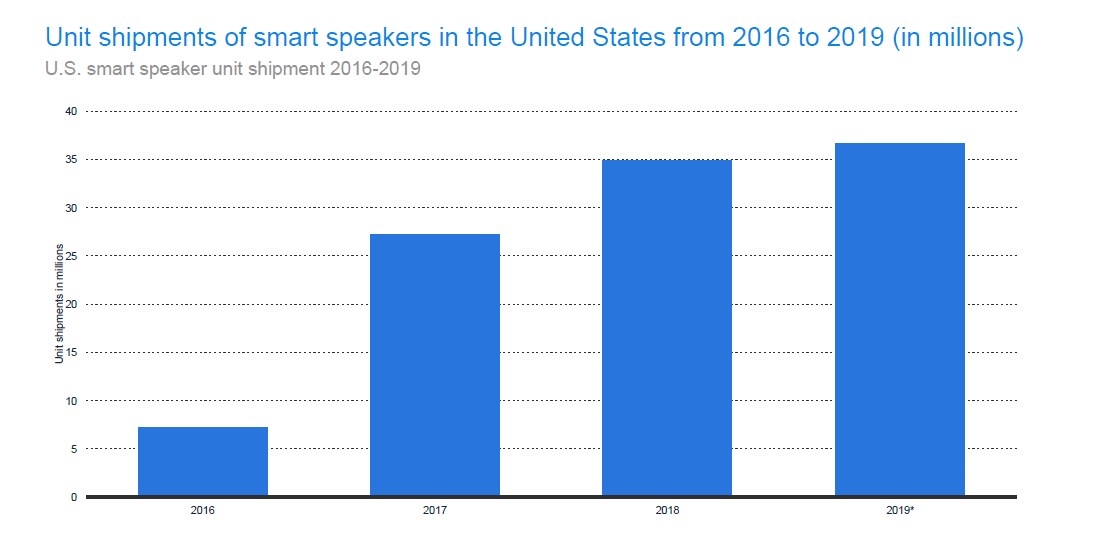
50. Amazon Speaker Unit Shipment
A smart speaker is a device that plays music and can provide answers to some of your verbal questions. Some home speakers can even control sections of your home through a built-in virtual assistant. For most people, a smart speaker is more than a music playback system – it is a hub for everyday information, including directions traffic, dictionary, and weather.
Many people buy smart speakers because of the convenience they offer, their flexibility in music listening, how they interact with other devices, and the sound quality.
So far in 2019 US received more than 35 million smart speakers. This is an increase from 7.5 million in 2016 and 27 million in 2017.
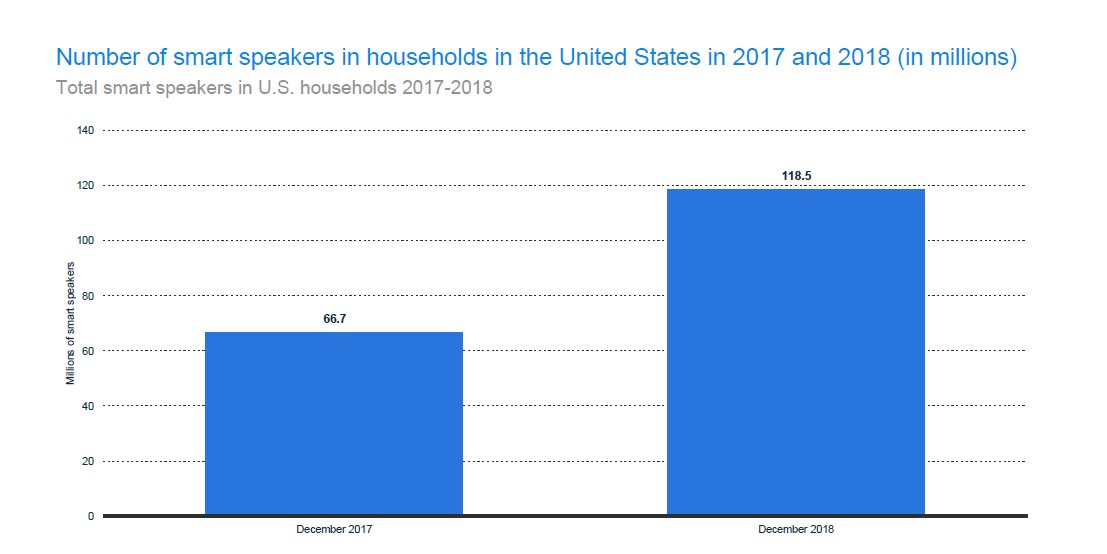
51. Number of Speakers in US Households
With so many smart speaker shipments, it means there are a lot of households with smart speakers. In 2018 alone, 118.5 million households in the US had smart speakers. This was an increase from 66.7 million households in December of 2017.
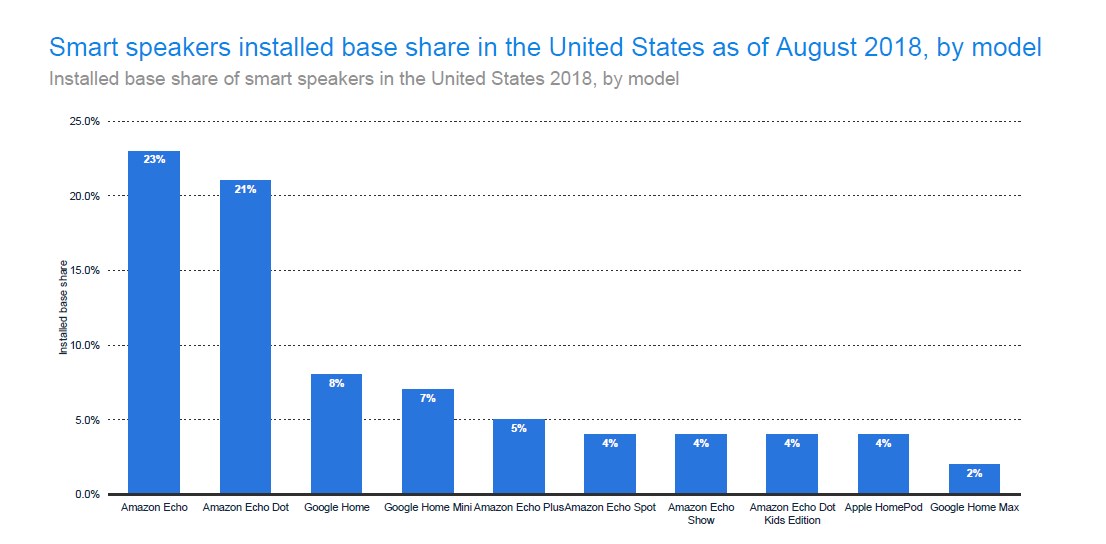
52. Installed Base Share of Smart Speakers in the US
There are several brands of smart speakers in the market. The brands include Amazon, Google, and Apple. Under these brands, there are a variety of product lines as well. But not all are doing great. According to Statista, Amazon Echo has the largest installation share at 23%. It is followed closely by Amazon Echo Dot at 21% and then Google Home and Google home Mini at 8% and 7% respectively. Apple HomePod comes in at 4% tied to Amazon Echo show and Amazon Echo Spot.
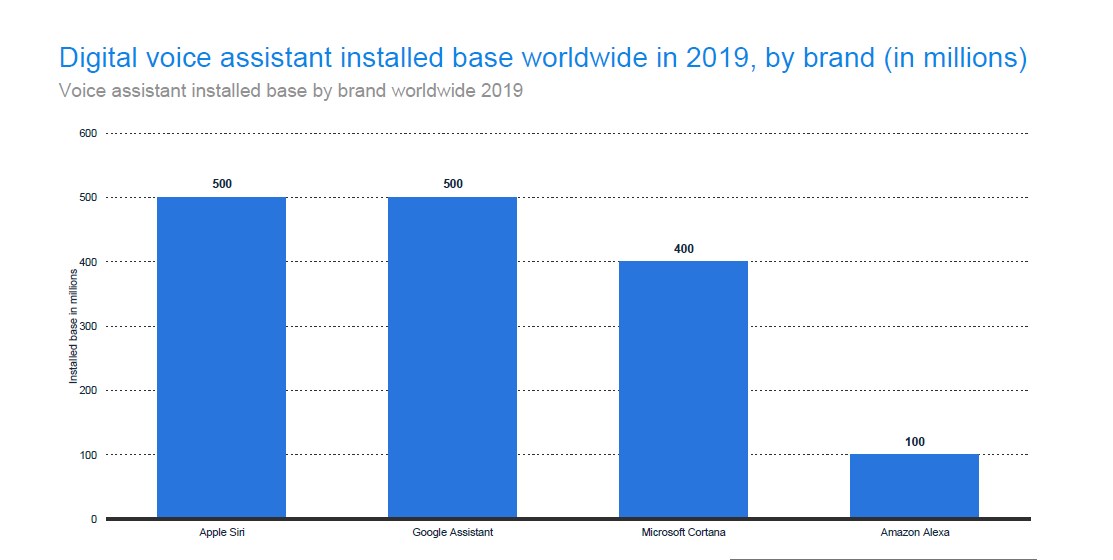
53. Voice Assistant Installed by Brand Worldwide
Smart speakers use virtual voice assistants. However, they are not the only gadgets that use it; smartphones do too. Among the four most popular virtual assistants, Apple Siri and Google assistant are leading the pack. According to Statista; the two have about 500 million installations. Microsoft Cortana has 400 million, while Amazon Alexa has 100 million.
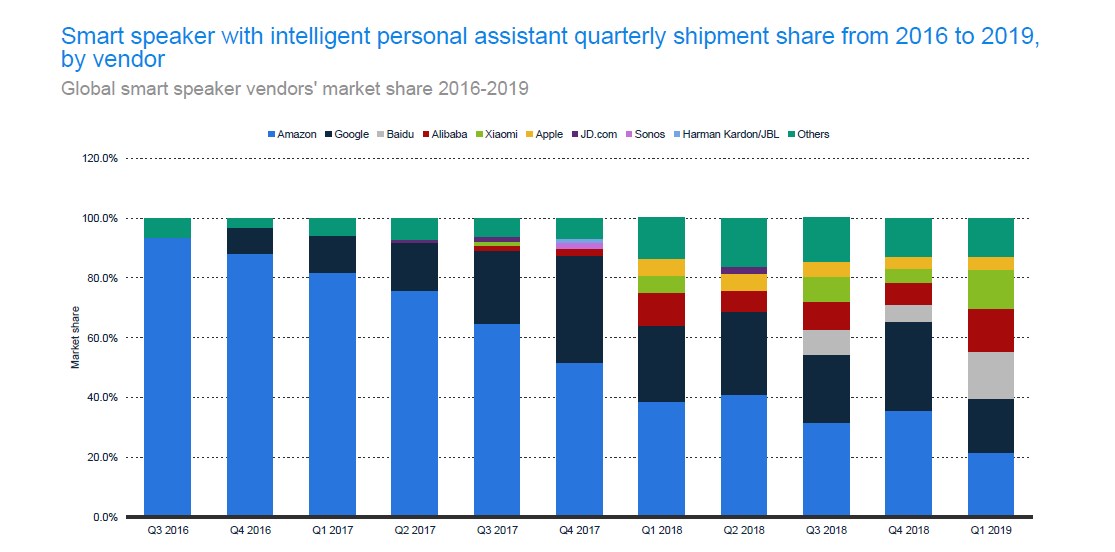
54. Who is shipping the highest number of smart speakers in the world
There are many smart speaker sources you can buy from. Some sources are preferred than others. In this sector, Amazon proves to be a beast. Statista shows that it is the leading vendor of smart speakers in the world, followed closely by Google and then Alibaba. Apple comes in last as a smart speaker vendor. In 2019, Amazon has shipped more than 5 million smart speakers.
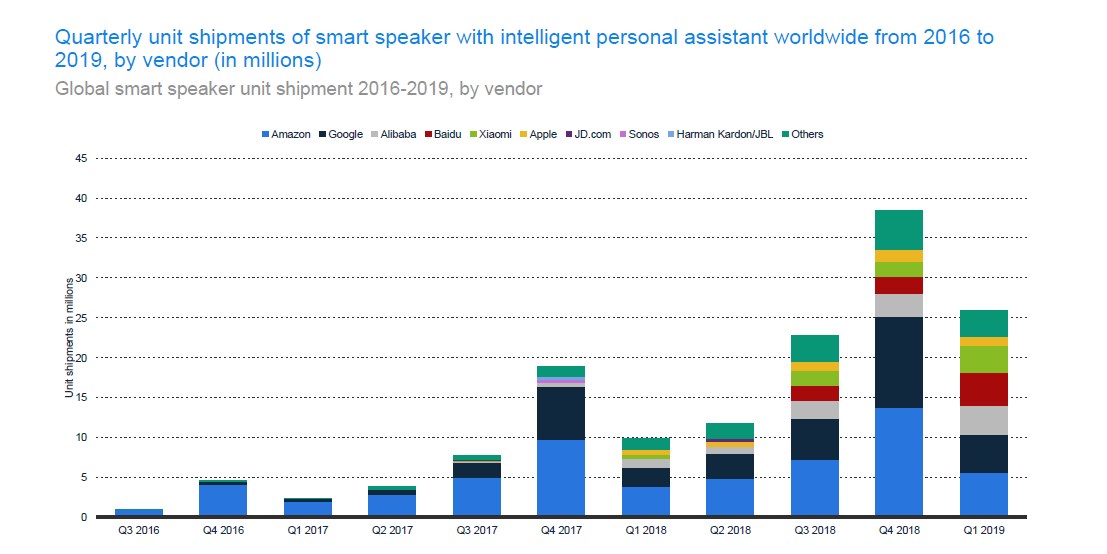
In terms of vendor market share, Amazon is leading the pack. In 2016’s 3rd quarter, Amazon had a vendor share of more than 90%. So far, in 2019, it has a share of more than 20%. And this is after many vendors like Xiaomi, JD.com, Alibaba, and Apple made their entry into the market.
55. Smart display built-in platform support share
Smart displays are like smart speakers, only that they come with touch screen displays. They sport voice assistant features just like smart speakers do. The voice assistants allow you to control other smart devices in your home, play music, and even check the weather forecast. However, with a screen, you get a lot of information including album art, upcoming weather for the week, and extra features like dimming lights to the right intensity.
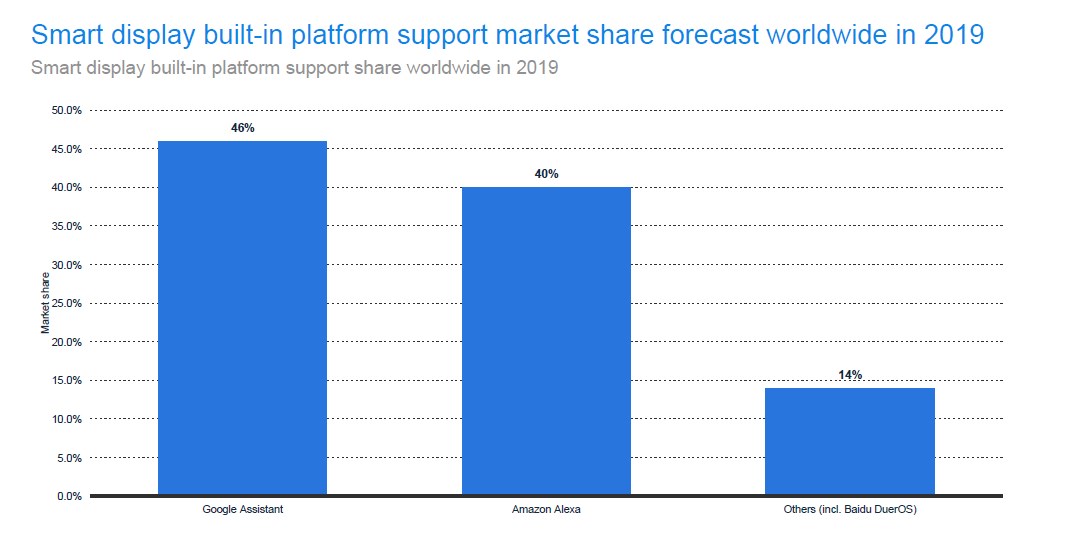
However, different voice assistant technologies have different compatibility levels. In this sense, Google assistant is leading with 46%, and Amazon Alexa is following closely with 40%. Other voice assistants share the remaining 14%.
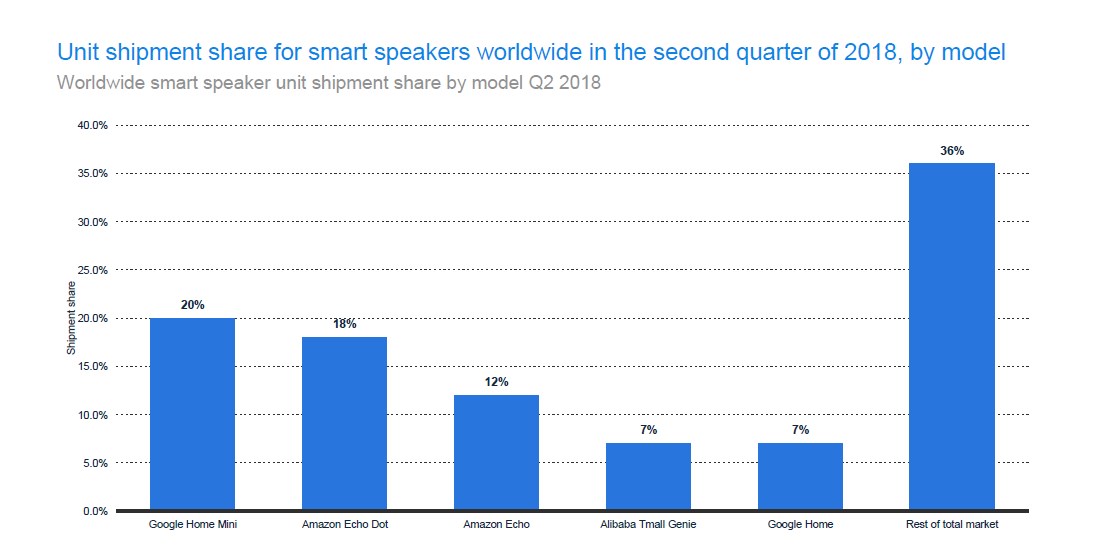
56. Worldwide Smart speaker unit shipment by the model
According to Statista, Google Home Mini had the largest unit shipment share in 2018. Its share was 20%, while Amazon Echo Dot came in second with 18%. Other speakers like Amazon Echo, Alibaba’s Tmall Genie, and Google Home follow closely with 12%, 7%, and 7% respectively.
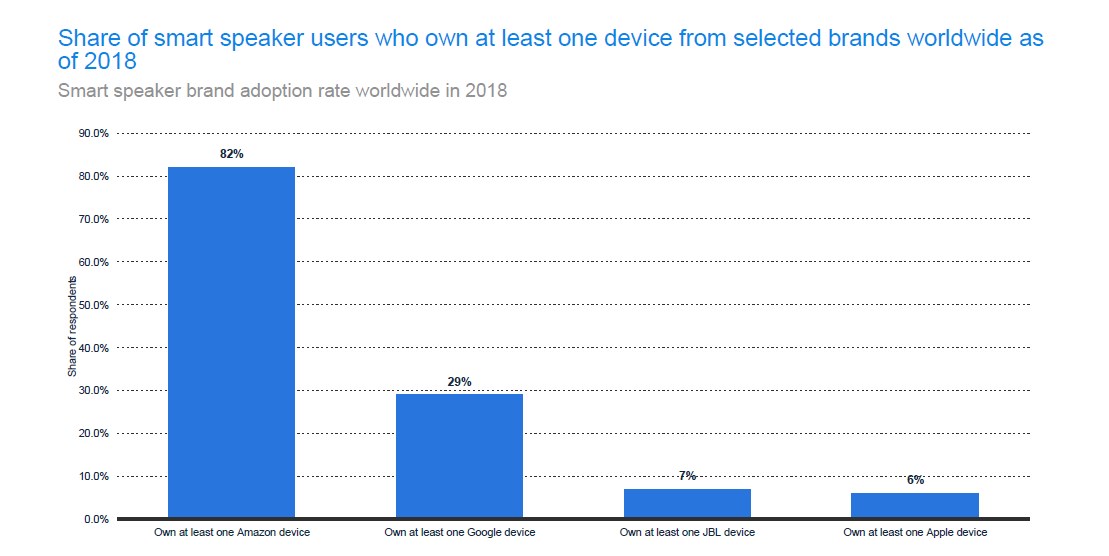
57. Share of smart speaker users according to the brand
Different brands have different smart speaker products with different features. It’s only logical that different people will fall in love with different products based on the features they offer. The purchase of different products collectively contributes to a brands market share and adoption rate. According to Statista, Amazon devices are leading with 82%, and Google devices come in second at 29%. Coming in third is JBL devices while Apple comes in 4th with 6%.
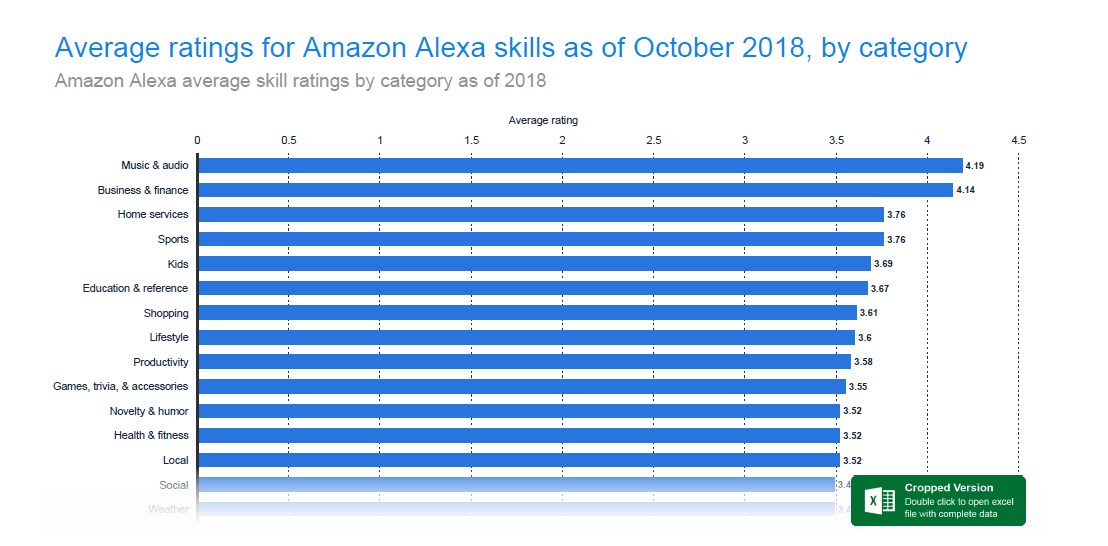
58. Average Amazon Alexa Rating
The Alexa Store has more than 40,000 skills. However, more than 62% of these skills don’t have a rating yet. The most popular skills category in the Alexa store is music and audio, business and finance, home services, sports, kids, education, shopping, and lifestyle.
Users rated these skills in 2018. Below are some of the ratings given to the different skills categories;
- Music and audio – 4.19
- Business and finance – 4.14
- Home services – 3.76
59. Annual revenue from Amazon Web Services
Amazon Web Services debuted in 2006. It started as a cloud computing platform that was to offer online services including Amazon Elastic Compute Cloud and Amazon S3, a service that as a large virtual computing capacity and probably the most popular in the industry. Many of the AWS servers, especially those called GOVCloud (these were designed for use by the US government), are located in the US.
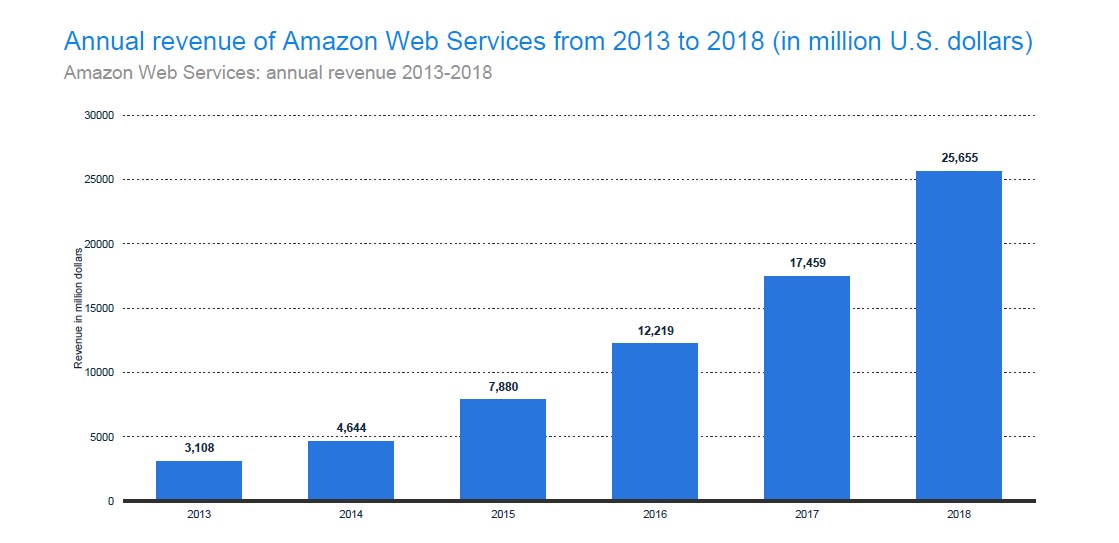
Moreover, Amazon has locations in Germany, China, Japan, Singapore, Ireland, Brazil, and Australia. In total, AWS has more than 1.4 million active servers in the world. The largest client is Netflix, which uses Amazon’s services to store its content (it’s quite ironic that Netflix is doing better than Amazon Prime Video, while Amazon hosts them on their servers).
From companies like Netflix, and other individuals using the servers, AWS made more than 25.655 billion in 2018 and 17.459 billion in 2017.
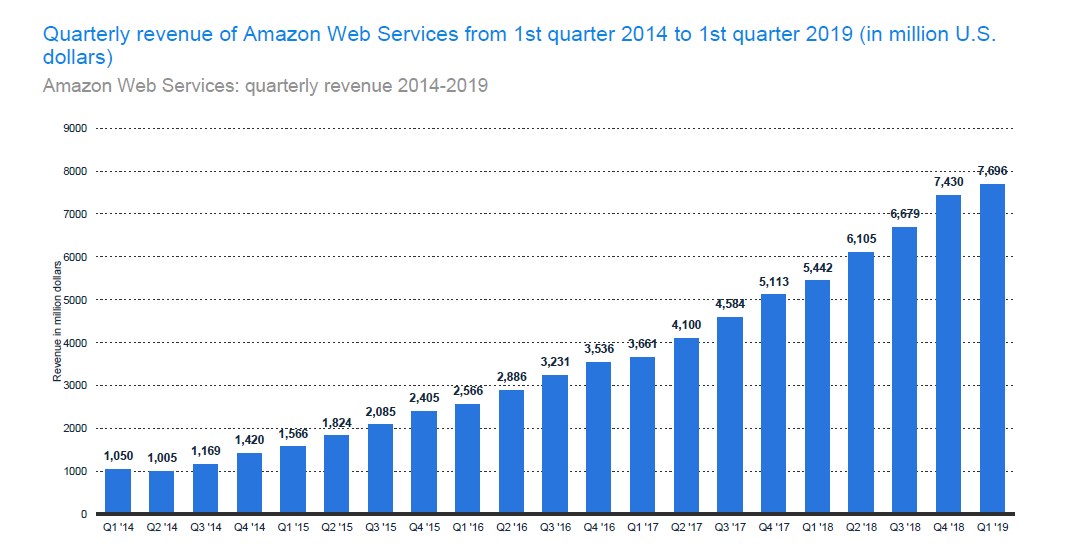
In the 1st quarter of 2019, AWS made a whopping 7.696 billion, which was more than what it made in the last quarter of 2018. But generally, AWS’s revenue has been increasing steadily since 2014 when it registered a quarterly revenue of 1.05 billion.
60. AWS Year on Year Growth
As Amazon’s e-commerce growth fluctuates, AWS growth is even more critical to its overall success. Amazon cloud business contributes about 40% of Amazon’s revenue. And this is despite it generating only 10% of revenues back in 2017. The huge leap in revenue contribution in a year is because AWS is a high margin business. It is reported to have 25% profit margins. Other non-AWS businesses operate with minimal margins. For instance, Amazon in North America operates with profit margins of between 2 and 3%, while Amazon International has been operating at a loss for quite some time.
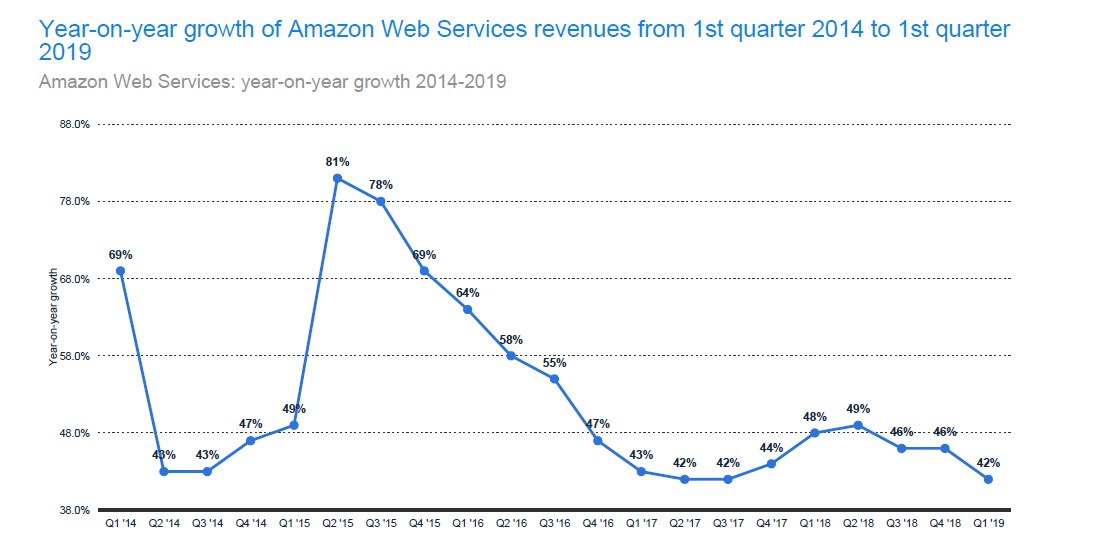
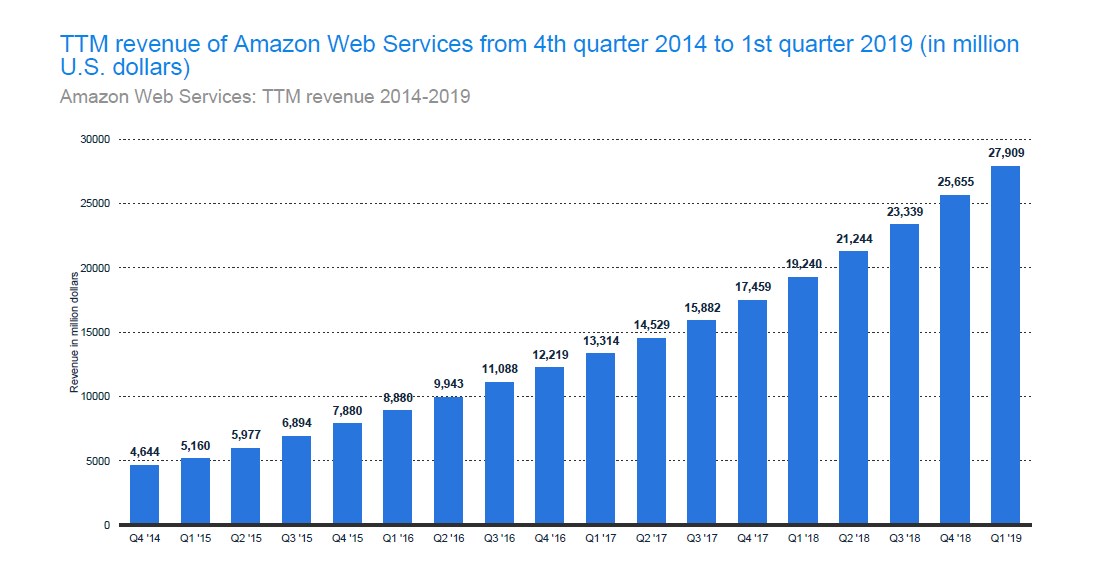
AWS revenues are expected to continue growing. And experts anticipate the revenues to hit $44 billion by 2020. Below is a summary of AWS revenue growths from 2014 to 2019.
61. Public Cloud Usage
The worldwide spending on public cloud infrastructure and services is expected to hit $210 billion by the end of 2019. This will be a 23.8% increase from 2018. And while there are many players in the industry, only a handful drive the industry. The few companies that have their teeth deep in the public cloud include AWS, Azure, Oracle Cloud, Alibaba Cloud, IBM Cloud, VMware cloud on AWS, and Google Cloud.
You probably expect to see Google Cloud at the top of the public cloud usage list. Unfortunately, it is not the leading service. AWS takes the lead on this. According to Statista, the current public cloud usage places AWS at 61% and Google Cloud at 19% on running apps. Other companies like VMware on AWS, Oracle cloud, and Alibaba cloud have 12%, 11%, and 3% respectively.
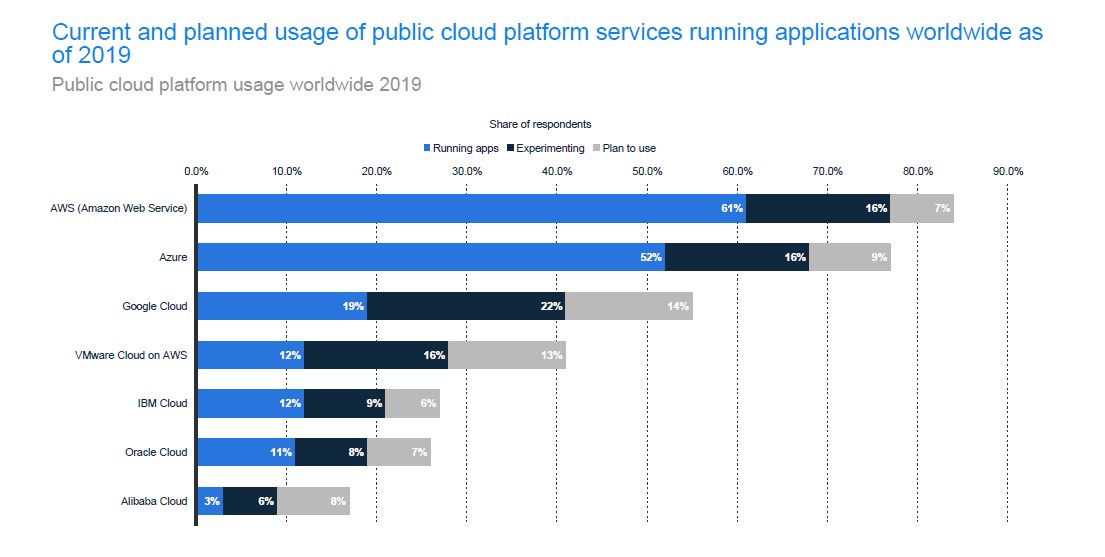
In addition to these, AWS 16% of survey participants came clean, saying that they have AWS and Google cloud for experimentation. Only 7% and 9% said they intend to use AWS and Google Cloud.
And in comparison to 2017 and 2018, AWS has increased in worldwide usage. In 2017, AWS’s usage was at 59%. In 2018 it was at 68%, and in 2019, it’s already at 67%. This number is expected to increase by the end of the year.
Though Amazon Business has had its fair share of highs and lows, overall, it seems to be winning and will continue to do so. But why are all these statistics important? Well, they do come in handy if you plan on doing business with Amazon as a seller or as a marketer. Also, if you intend to be one of their consumers, it is great to know what other consumers in the US and the world are responding well to. This will give you a good idea of what to invest in and what to stay away from.
But as we’ve said, so far, Amazon’s journey has been a success, and a lot more is in store for this e-commerce giant.