

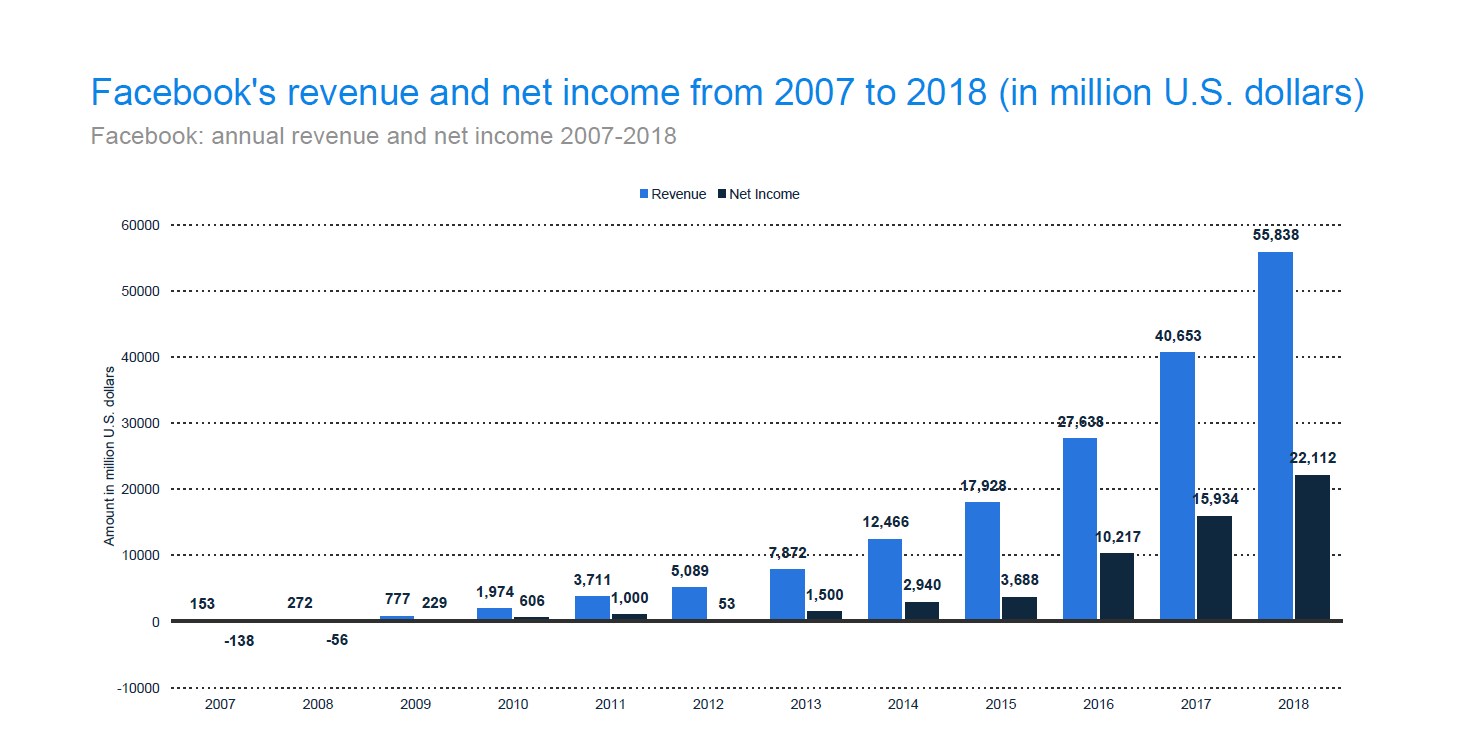
How does Facebook make its money? That’s one of the most asked questions about Facebook, unsurprisingly considering the tech giant made $55.838 billion in the 2018 fiscal year and $15.077 billion in the first quarter of 2019 (source – Statista, pg. 8 & 10).
Facebook is a free platform, so it doesn’t get revenue from its users; not directly anyway. It,however, leverages user data to sell advertising. The exact ins and outs are complicated but here’s a simplified version.
In exchange for the free service, Facebook requires users to give some personal data like age, gender, location and whatnot. It then tracks their online activity like the things they post, what they share, the kind of posts they comment on etc.
The social media company uses that information to show its users ads that it thinks they might like. And companies/sellers pay big bucks to ensure that their ads are viewed by relevant audiences. In other words companies pay Facebook to ensure that their products reach the right customers (source – https://www.inverse.com/article/44566-how-does-facebook-make-money-mark-zuckerberg).
That’s basically how the tech giant makes most of its money – by selling advertising services. Exactly how much money are we looking at? Here’s a breakdown of the numbers:
1. Advertising accounts for 98.5% of Facebook’s revenue
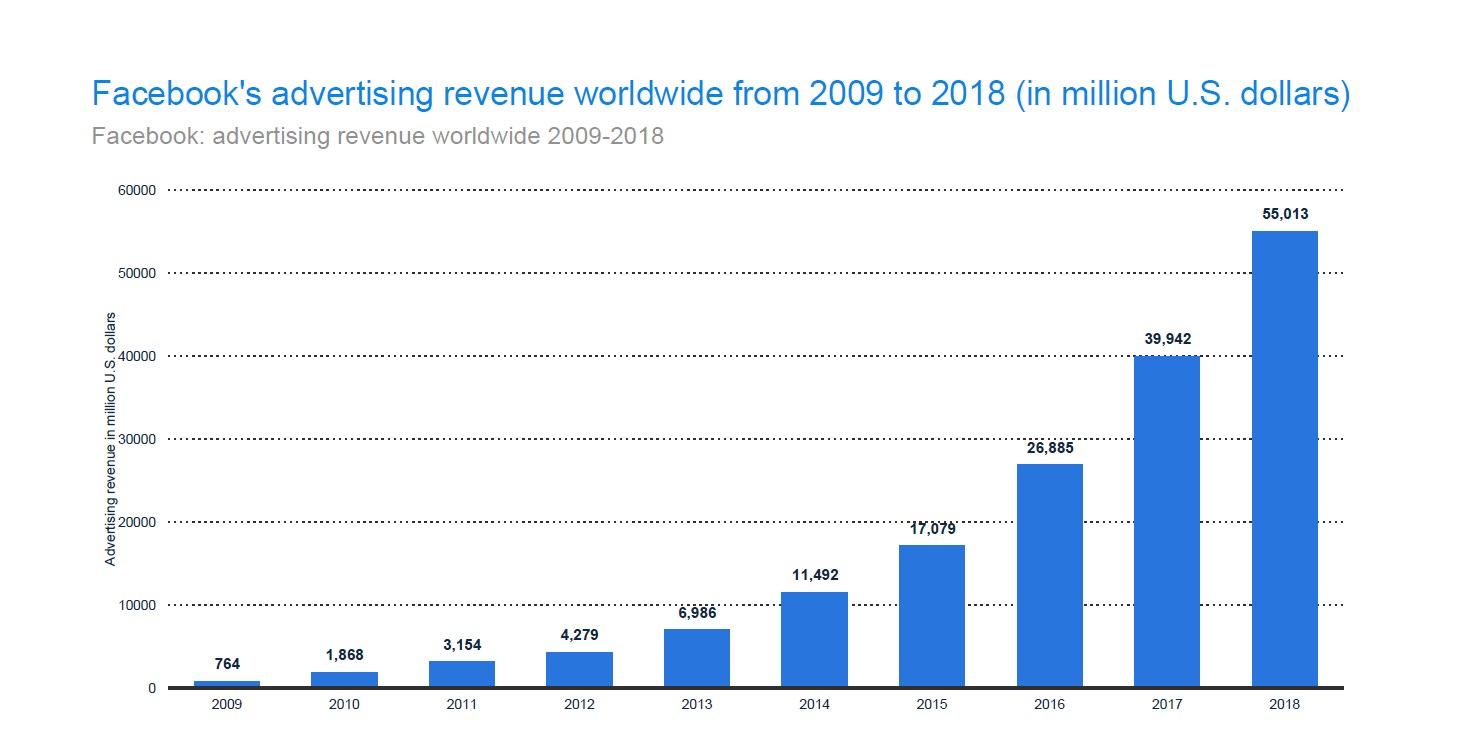
Facebook made a revenue of $55.838 billion in 2018, by far the largest income by any social media company (source – Statista, pg. 18). Of that amount, $55.013 billion (or 98.52%) came from advertising, with the rest coming from payments and other fees received (source – Statista, pg. 9).
It was a 37.7% surge in advertising revenue compared to the $39.942 billion registered in the previous year.The record-breaking revenue came despite the company being underconstant fire after the Cambridge Analytics scandal. How did Facebook manage to achieve the feat?
First of all, social media is a game of numbers. A network with a large number of users will be a favorite for ads because naturally sellers want a platform with the biggest audience. And as far as audiences go Facebook is the champ in the social media world. Up to 2.7 billion people use Facebook products every month (source – Statista, pg. 22). It’s not even a close raceseeing as second-placed YouTube has 1.9 billion active users (source – https://www.statista.com/statistics/272014/global-social-networks-ranked-by-number-of-users/).
Although the Cambridge Analytica scandal affected Facebook’s overall reputation, it had no material impact on the number of active users and sellers’ will to advertise with the company. In fact, Facebook’s monthly active users rose from 2.129 billion in Q4 of 2017 to 2.375 billion in Q4 of 2018 (source – https://www.statista.com/statistics/264810/number-of-monthly-active-facebook-users-worldwide/). In a Digiday survey (conducted in November 2018 – after the Cambridge Analytica scandal), 50% of ad buyers said that they would increase their spending on Facebook Ads. Overall, 62.1% of the respondents said that the scandal had no effect on how much they were willing to spend on Facebook Ads (source – https://digiday.com/marketing/facebook-earnings-q4-2018/).
This unmatched ability to attract active users and ad buyers is what keeps Facebook at the top of revenue rankings among social media companies.
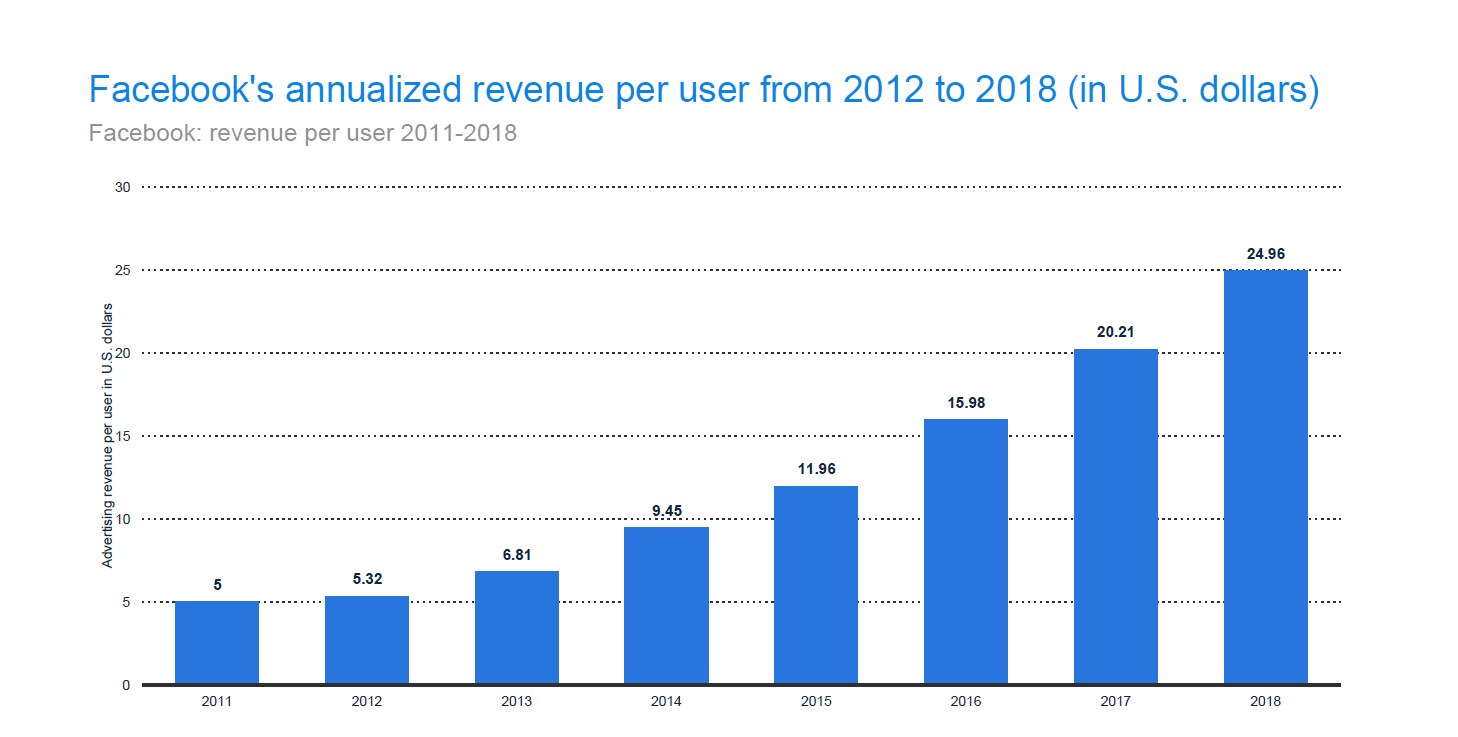
2. Facebook made more revenue per user in 2018 than ever
If you are a Facebook user then all the scrolling you did in 2018 earned the company $24.96, $4.75 more than 2017 ($20.21). Even more staggering is that the amount more than doubled in the 3 years from 2015 (source – Statista, pg. 58).
Interestingly, the site’s daily and monthly active users both grew by 9% while revenue grew by 37%. That means revenue growth was 311% faster than user growth (source – https://thespring.io/investing/facebook-makes-more-revenue-per-user-than-netflix/).
How can revenue grow faster than the number of active users? The answer to that lies in the number of active advertisers. Even if Facebook’s audience shrinks (and it is shrinking in some segments like Europe where the networking site lost 1 million active users in 2018 (source – https://digiday.com/marketing/facebooks-making-money-per-user-north-america-ever/), its revenue can still grow provided more ad buyers come in. that is precisely what happened in the two years leading up to 2018.
In Q1 2016, Facebook had 3 million active advertisers. By Q1 2018 the number had doubled to 6 million (source – https://www.statista.com/statistics/778191/active-facebook-advertisers/).The increment means that Facebook had a bigger pool of money collected from Facebook Ads. Besides, ad buyers paid significantly more in 2018 than they did in 2017.
While the average cost per click was $0.97 in 2017 (source – https://adespresso.com/blog/facebook-ads-cost/), it rose to $1.86 in 2018 (source – https://fitsmallbusiness.com/how-much-does-facebook-advertising-cost/) thus explaining why Facebook’s revenue per user had an unprecedented surge. It basically means that in 2018 Facebook charged ad buyers nearly twice as much as it did in 2017, and the result was not just a 23.5% rise in revenue per user (from $24.96 to $20.21) but also a 37.7% increase in advertising revenue (from $39.942 billion in 2017 to $55.013 billion in 2018).
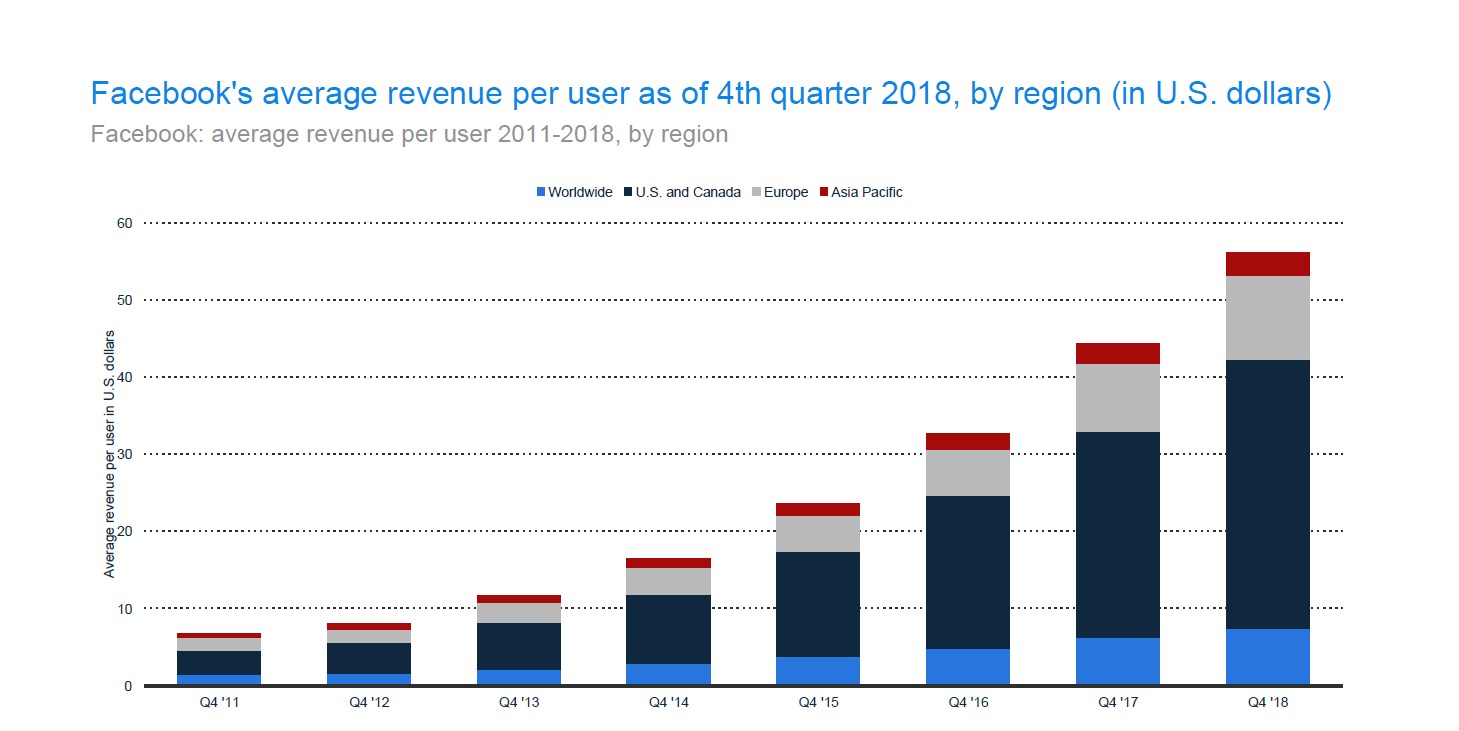
3. North America earns Facebook the most money
The US and Canada are Facebook’s money tree. The social network made more revenue from the two countries than all the other regions combined. That’s down to the high revenue per user in North America. On average, each Facebook user in the US and Canada earned the company $34.86 in 2018, more than Europe ($10.98), Asia Pacific ($2.96) and the rest of the world ($7.37) combined.
The value looks even more gigantic when compared to what other social media can manage. With their $9 and $6 average revenue per user, Twitter and Snapchatcome in second and third respectively (source – https://thespring.io/investing/facebook-makes-more-revenue-per-user-than-netflix/).
What’s more impressive is that America accounts for just about 10% of all Facebook users (source – https://blog.hootsuite.com/facebook-statistics/). To put that into perspective, 10% of Facebook’s users contribute 62.1% of its total revenue per user.And Facebook earned more than Amazon Prime and Netflix from the average North American. Keep in mind that Amazon Prime has an initial subscription fee of over $100 while Netflix charges $10 per month. Even with those revenue collection structures the two companies can’t beat Facebook, which is free, in average revenue per user(source – https://thespring.io/investing/facebook-makes-more-revenue-per-user-than-netflix/).
It may not be exactly clear why the North American market is lucrative but one thing for sure is that U.S. and Canadian citizens spend quite a substantial amount of time on Facebook. On average, American Facebookersdedicate 58 minutes of their day to the network(source – https://blog.hootsuite.com/facebook-statistics/).
4. Facebook’s mobile revenue doubled in 5 years
It’s no secret that the use of mobiles has grown tremendously over the past decade. In 2018, there were 1.4 billion shipments of smartphones, up from (a mere) 173.5 million in 2009 (source – https://www.statista.com/statistics/271491/worldwide-shipments-of-smartphones-since-2009/). Nowhere has the growth been more prominent than in social networking.Of the 3.48 billion social media users in 2019, 3.26 billion access is via mobile devices; a 10% rise from the 2018 figures (source – https://datareportal.com/reports/digital-2019-global-digital-overview).
Facebook has been the biggest gainer in terms of both the number of mobile users and revenue from mobile ads. An estimated 96% of all Facebook traffic is from mobile devices (smartphones and tablets combined). Only 25% originates from computers (source – https://www.statista.com/statistics/377808/distribution-of-facebook-users-by-device/).
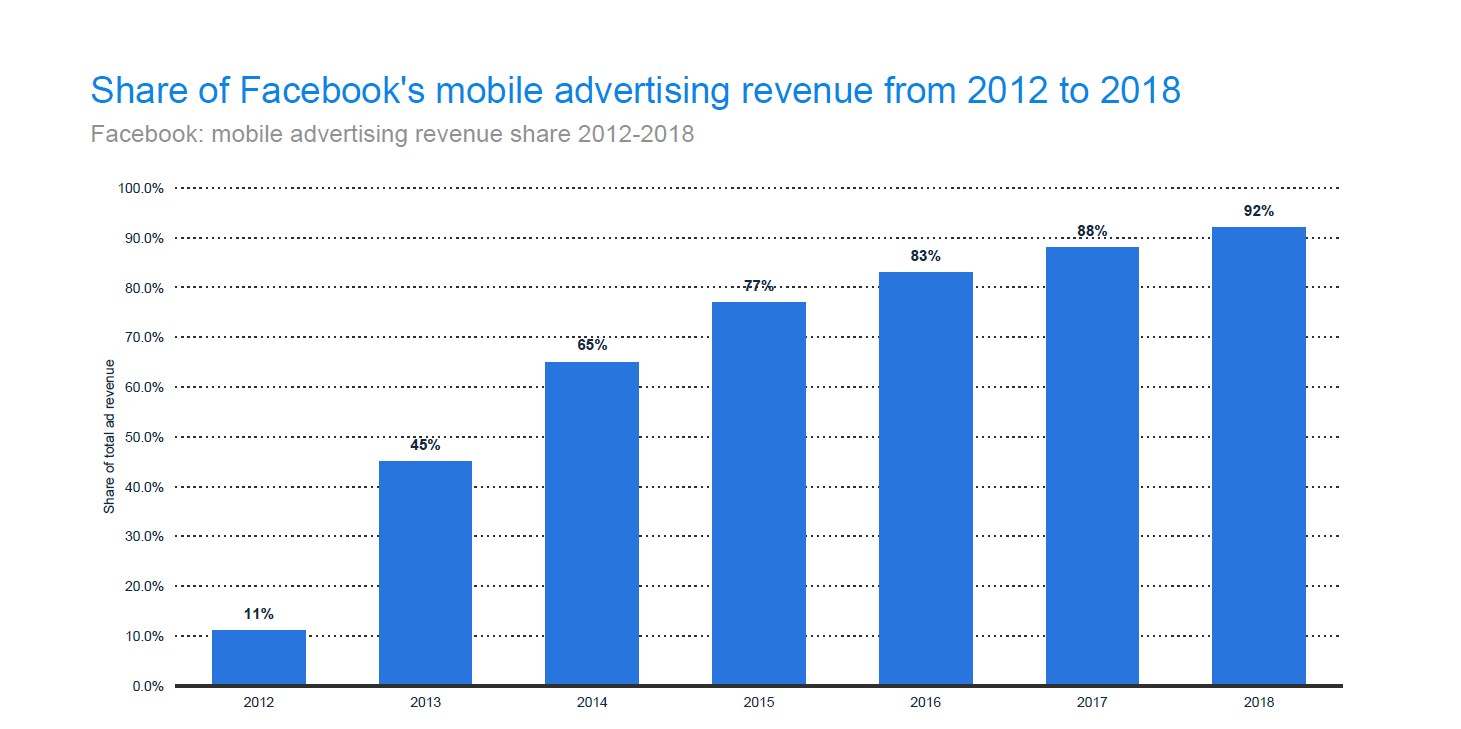
Unsurprisingly, Facebook’s high mobile traffic translated to high mobile revenue. 92% of the company’s 2018 earnings came from mobile advertising revenue, a 4% jump from the mobile revenue registered in 2017. 5 years earlier – in2013 – Facebookonly managed 45% mobile revenue. The value was even lower in 2012 (11%) (source – Statista, pg. 60).
In other words the growth of mobile traffic increased mobile revenue as it allowed Facebook to run more ads that are mobile-friendly and therefore tailored to reach a wider audience – the audience that uses smartphones and tablets.
Mobile revenue values can only go up seeing as ad buyers are embracing ads being displayed on Stories. In Q1 of 2019, Stories Ads reached up to 3 million people across Facebook platforms, primarily Instagram, Facebook and WhatsApp (source – http://www.businessofapps.com/news/facebook-mobile-ad-revenue-jumps-30-to-13-9-billion/).In total, as many as 2 million advertisers use Stories and Instagram Stories alone has reached 500 million daily active users (source – https://martechtoday.com/despite-ongoing-criticism-facebook-generates-16-6-billion-in-ad-revenue-during-q4-up-30-yoy-230261).
So, how are Stories and mobile revenue related? Most people who use Stories also use mobile devices because of their convenience in capturing images and videos (which are both crucial in Stories). And the more the stories the bigger their audience, which in turn translates to a higher mobile revenue for Facebook.
5. Samsung is more popular on Facebook than YouTube and McDonald’s combined
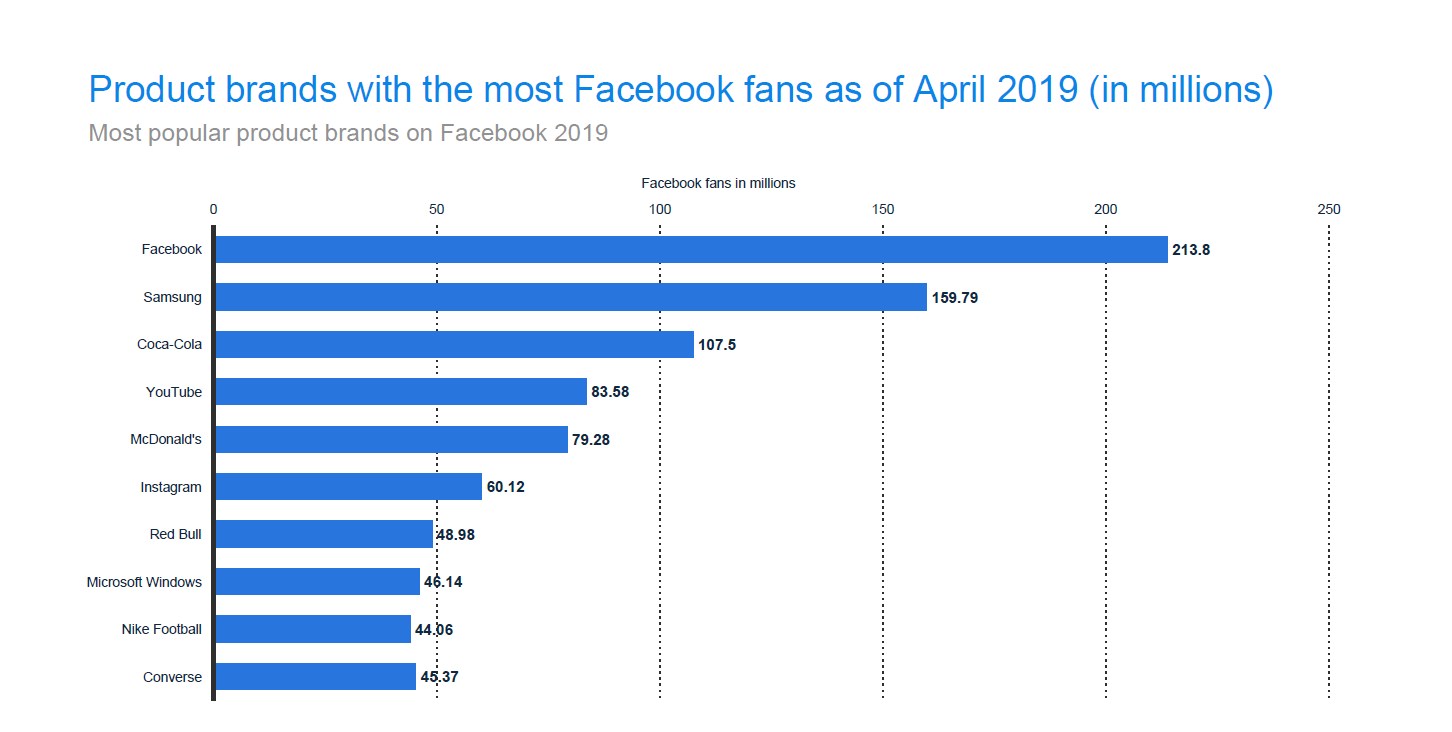
With over 213.8 million fans as of April 2019, Facebook is the most popular brand on Facebook (source – Statista, pg. 65). In fairness to other brands it’s near impossible to beat Facebook on Facebook. But what’s more interesting is that the official Facebook Page has more fans than YouTube and Coca-Cola combined, both of which are huge multinational brands.
YouTube has 83.58 million fans and ranks fourth in popularity after Coca-Cola and Samsung which have 107.5 million and 159.79 million fans respectively.Instagram, which is owned by Facebook, comes in sixth with 60.12 million fans, roughly 10 million less than fifth-placed McDonald’s (source – Statista, pg. 65).
All the above companies are huge brands with the ability to pull millions of fans and followers. That said, some curious cats may be more interested in the Facebook-Samsung partnership. It’s no secret that the two companies have a longstanding relationship. In 2012, it was reported that Samsung spent ten million dollars to advertise the Galaxy S3 on Facebook. Samsung’s total expenditure on Facebook ads amounted to over $100 million that year (source – https://www.healthnutnews.com/the-35-biggest-advertisers-on-facebook/).
What did Samsung get in return? Of course targeted advertising by Facebook, and that had a huge impact on Galaxy S3 sales. The 3-week campaign reached an estimated 105 million unique Facebook users and netted Samsung $129 million. Perhaps more importantly to Samsung, the campaign contributed a great deal to the disappointing sales of Apple’s iPhone 5 which also hit the market that same year (source – https://www.cnet.com/news/facebook-ads-really-work-just-ask-samsung/). Don’t believe those who say Facebook ads don’t work!
While there are no recent records of Samsung’s spending on Facebook ads, it’s safe to say that they are spending a lot more than the 100 million spent in 2012. That would explain why most Samsung mobile devices come with a pre-installed Facebook app that can only be deactivated but not deleted (source – https://www.inc.com/minda-zetlin/samsung-phones-facebook-pre-installed-permanently.html). Needless to say, this relationship has had its fair share of controversies, especially after it was discovered that Samsung is one of the companies that have been given access to user data by Facebook (source – https://economictimes.indiatimes.com/tech/internet/facebook-partners-samsung-micromax-and-airtel-with-targeted-ads/articleshow/50032763.cms).
6. Cristiano Ronaldo is the most followed person on Facebook
The Portuguese soccer (or football – depending on where you’re reading this from) player who plays for the Portugal national team and Juventus Football Club in Italy is the most followed individual on Facebook. He has 122.3 million fans (as of May 2019) and is ranked third overall after Facebook and Samsung which have 214.08 million and 159.8 million fans respectively (source – Statista, pg. 64).
Ronaldo is not the only individual competing with multibillion brands in terms of Facebook followers. The likes of Shakira (musician), Vin Diesel (actor), Lionel Messi (soccer player), Eminem (musician) and Rihanna (musician) all make the top 15, garnering 578.5 million followers combined.
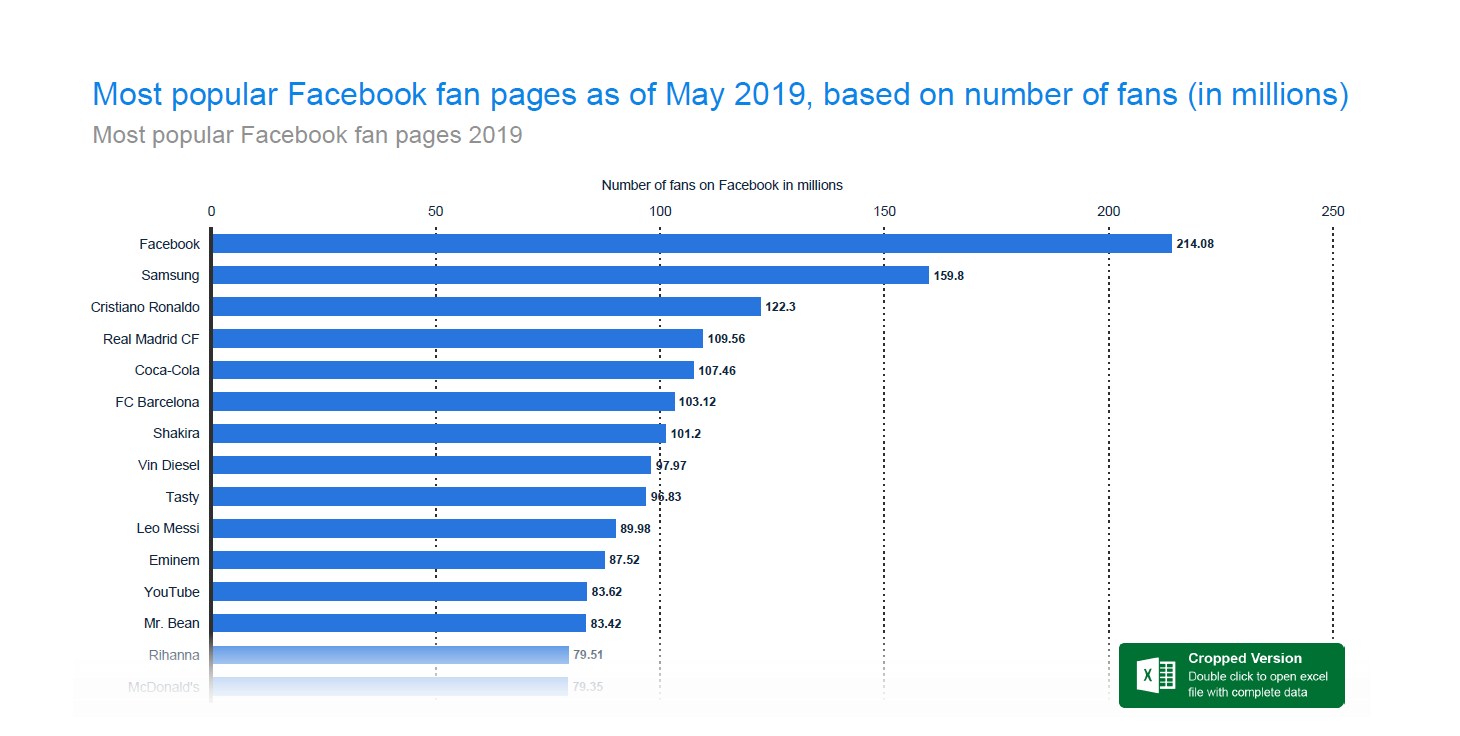
Overall, music and soccer dominate Facebook following. Real Madrid Football Club (where Cristiano played his soccer until 2018) and Barcelona (where Messi plays his soccer) are ranked fourth and sixth with 109.56 million and 103.12 million Facebook fans respectively. Shakira, Eminem and Rihanna boast 101.2 million, 87.52 million and 79.51 million followers respectively (source – Statista, pg. 64).
You might be tempted to conclude that if you want your posts and ads to reach a wider audience you have to figure a way of making them football or music-related. You wouldn’t be entirely wrong, but keep in mind that there are companies outside of those two fields that attract a huge following too. Besides the obvious Facebook, there’s Samsung (tech), Coca-Cola (beverages), Tasty (food), YouTube (internet/tech), Mr. Bean (TV) and McDonald’s (food).
7. 54 million Facebook users Like Instagram
Facebook acquired Instagram in 2012 for $1 billion despite the latter having made no revenue. At the time, Instagram had just 30 million users (source – https://www.vox.com/2017/4/9/15235940/facebook-instagram-acquisition-anniversary). It looked like a big gamble to many, but the good people at Facebook knew what they were doing.
Today, Instagram has roughly 1 billion monthly active users, 500 million daily active users (source – https://www.omnicoreagency.com/instagram-statistics/) and generated a revenue of 9 billion in 2018 (source – https://marketrealist.com/2019/01/instagrams-ad-revenue-more-than-doubled-in-2018/).
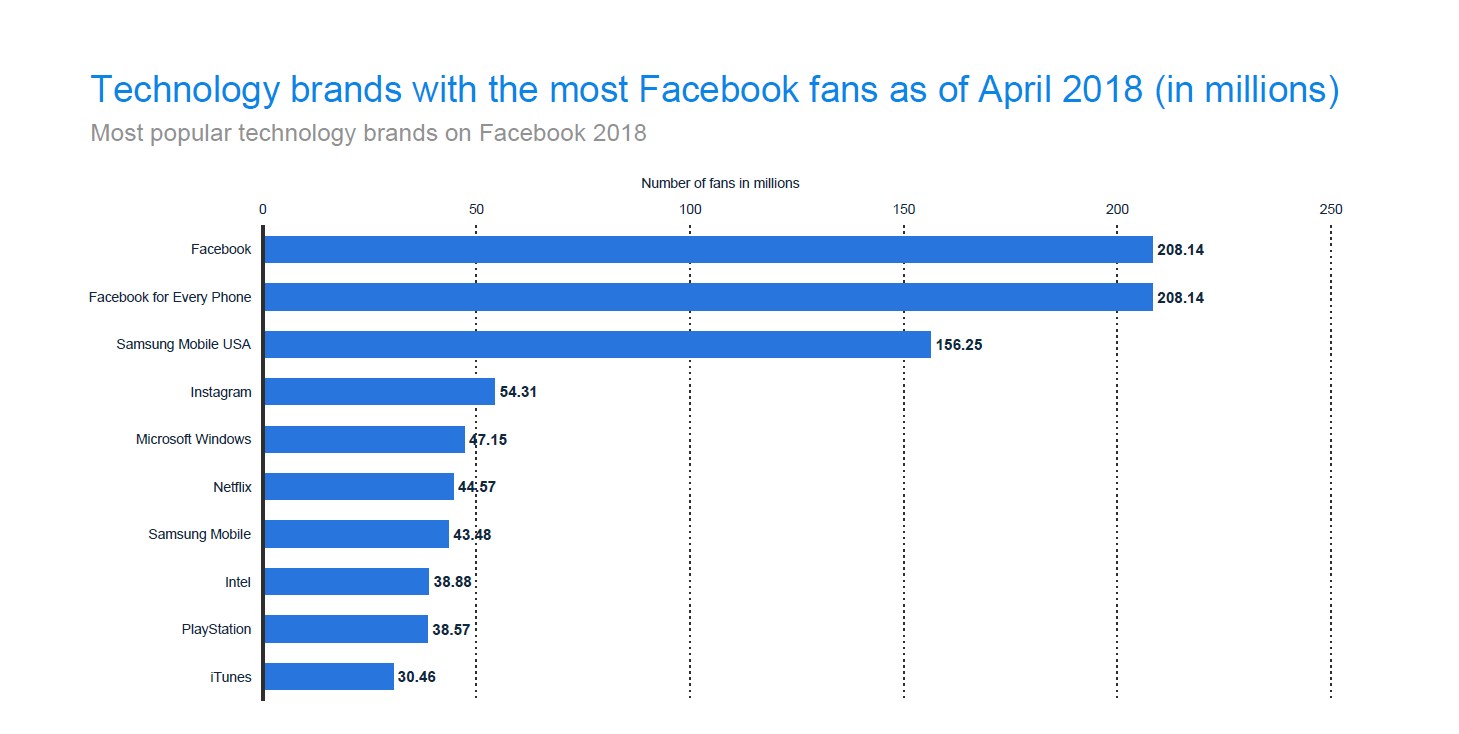
The numbers indicate that it was a decent piece of business, not just for Facebook but its users as well. Now people can link their Facebook and Instagram profiles and even post their Instagram activities to their Facebook profiles and vice-versa. This convenience could be the reason why some 54.31 millionusers followedInstagramon Facebook as of April 2018 (source – Statista, pg. 66).It’s the fourth most popular tech brand. Facebook and Facebook for Every Phone lead the chart with 208.14 million followers each followed by Samsung Mobile USA which has 156.25 million Facebook fans. Microsoft Windows, Netflix, Samsung Mobile, Intel, PlayStation and iTunes complete the top 10 most popular tech brands on Facebook.
8. Tech pages are the most “Liked” on Facebook
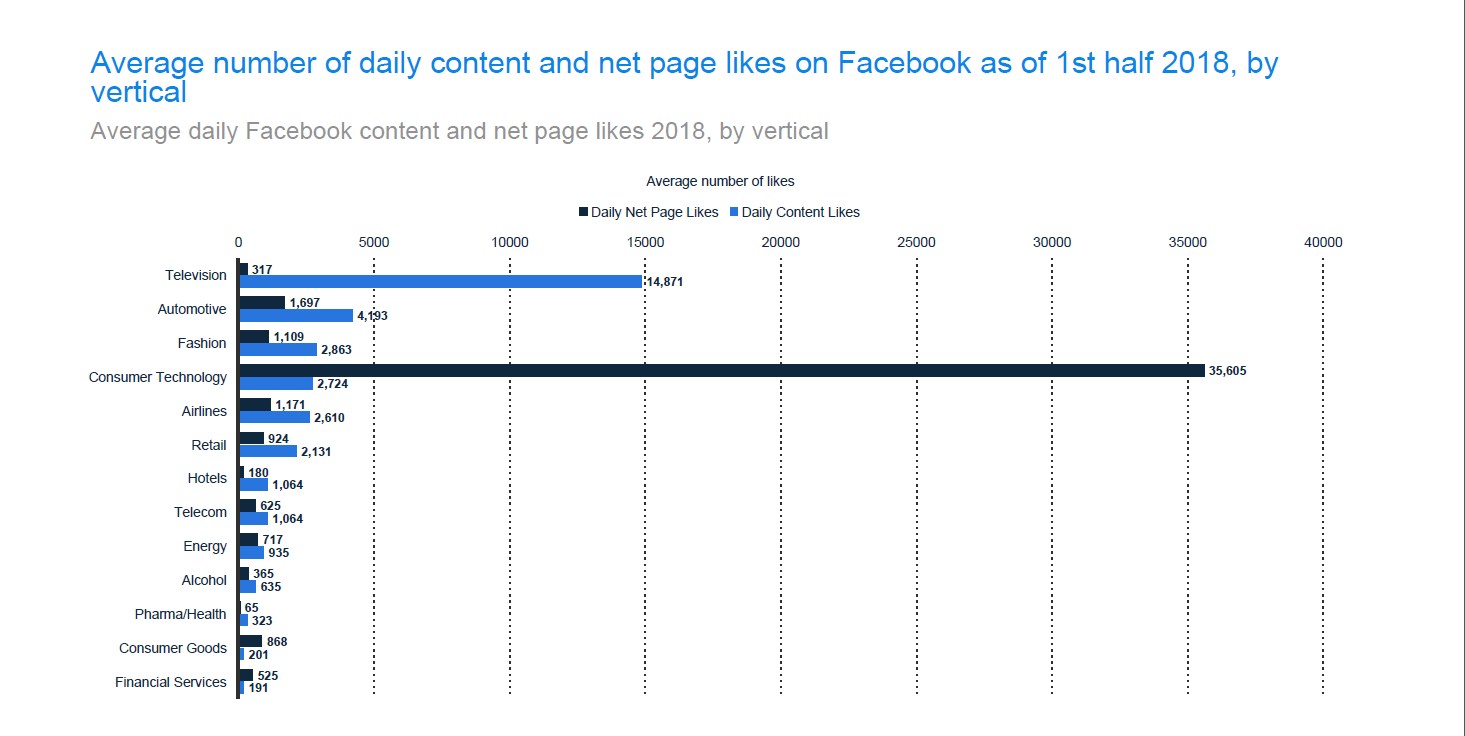
As long as we’re talking matters technology it’s worth noting that Facebook Pages of tech brands get the highest number of likes. More specifically, consumer technology Pages get an average of 35,605 Page Likes every single day. Automotive pages come in a distant second with an average of 1,697 Page Likes per day. Airlines, fashion, retail, consumer goods, energy, telecom and financial services fill up the remaining spots in the 10 most liked pages per day (source – Statista, pg. 61).
Looking at the top Facebook ad buyers gives a glimpse of why tech brands get the most page likes. First of all, it’s important to understand that getting a lot of page likes is extremely hard if you’re not advertising, and that (sort of) makes it hard for small businesses that have small advertising budgets to get tens of millions of page likes. On the other hand, big companies with big advertising budgets can pull millions of followers with year-round paid ads.
While there are no recent data, records from 2012 indicate that 5 of the top 10 Facebook ad buyers were tech companies. Samsung was the biggest spender with $100 million going to Facebook ads. Microsoft spent an estimated $35 million while Amazon and Verizon’s budgets were about $30 million each. AT&T reportedly made the top 10 but their numbers were hard to find (source – https://www.businessinsider.com/top-advertisers-on-facebook-2013-11?IR=T). This simply proves that the most popular brands on Facebook are spending quite a fortune on Facebook ads to stay popular.
As far as content likes, TV Pages take the lead with 14,871 likes per day. This is likely due to the fact that a good number of internet users rely on Facebook for news. In the US, up to 43% of the population gets its news from Facebook (source – https://blog.hootsuite.com/facebook-statistics/). Automotive pages get the second highest daily content likes followed by fashion, consumer technology, airlines, retail, hotels, telecom, energy and alcohol brands (source – Statista, pg. 61).
9. It pays to post frequently on Facebook, just ask TV brands
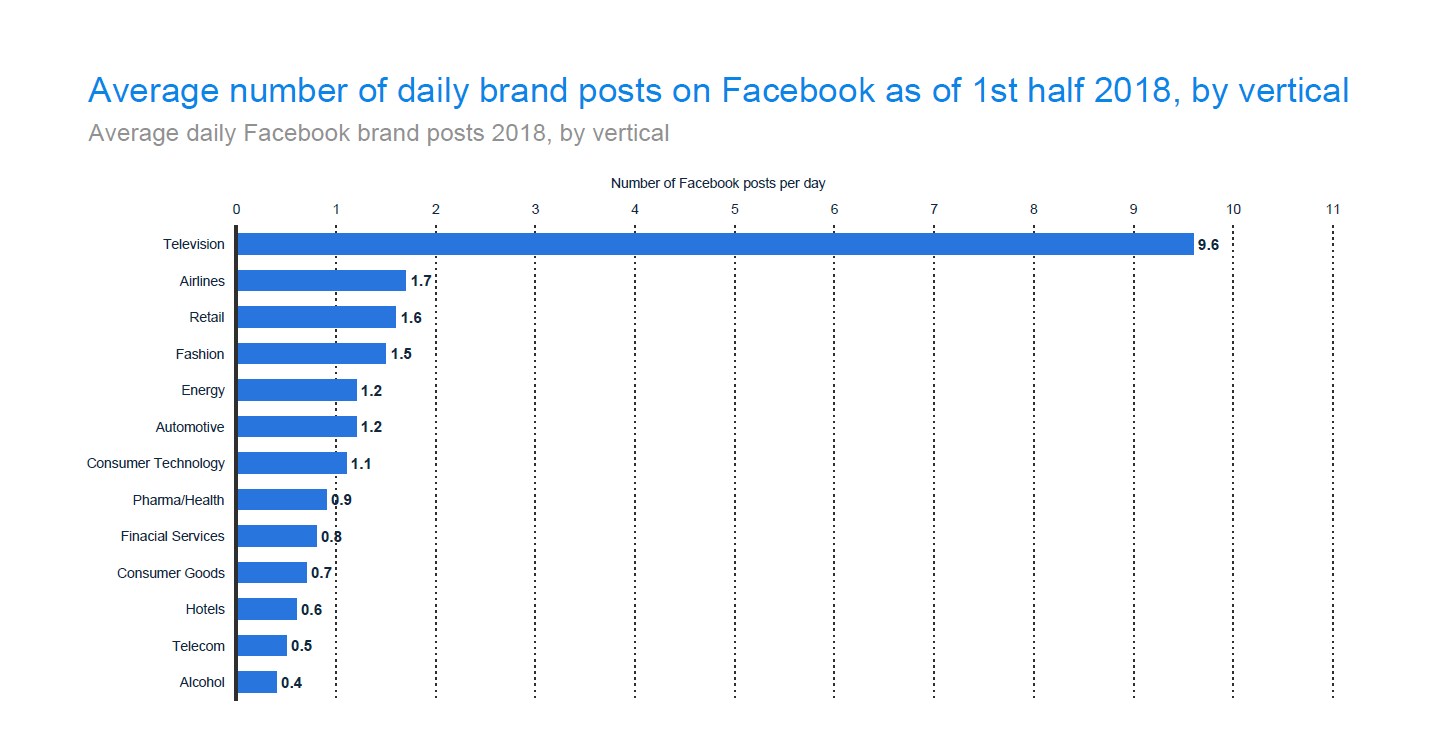
Having so many Facebook posts can translate to a high number of content likes.That may explain why content posted by television brands gets the highest number of likes – because they post more frequently than any other brands. On average, television brands post approximately 9.6 times per day, more than any other category of brands. Airlines come in second with 1.7 posts as retail, fashion and energy brands scoop the third, fourth and fifth spots with 1.6, 1.5 and 1.2 Facebook posts each day (source – Statista, pg. 62).
The tendency of TV brands to post frequently pays off, at least as far as content likes go. With 14,871 likes per day, TV posts are the most liked on Facebook (source – Statista, pg. 62). And there’s a reason why televisions want to keep their likes up: to boost their ratings.
In a 2011 survey by NM Incite (a Nielsen/McKinsey company), it was discovered that a TV brand gets higher ratings when its content generates “online buzz” (source – https://www.nielsen.com/us/en/insights/news/2011/the-relationship-between-social-media-buzz-and-tv-ratings.html).
But it’s not all about TV brands and their ratings, there’s the aspect of news as well. As mentioned already, an estimated 43% of Americans get their news from Facebook, and TV channels play an important role in relaying that news. Whether it’s breaking news, a developing story or a follow up for an event that already occurred, TV stations are always on hand to post about it on Facebook, and that’s the type of content that gets plenty of interactions, especially likes.
10. Fox News and Daily Mail take the lead in user engagement among publications
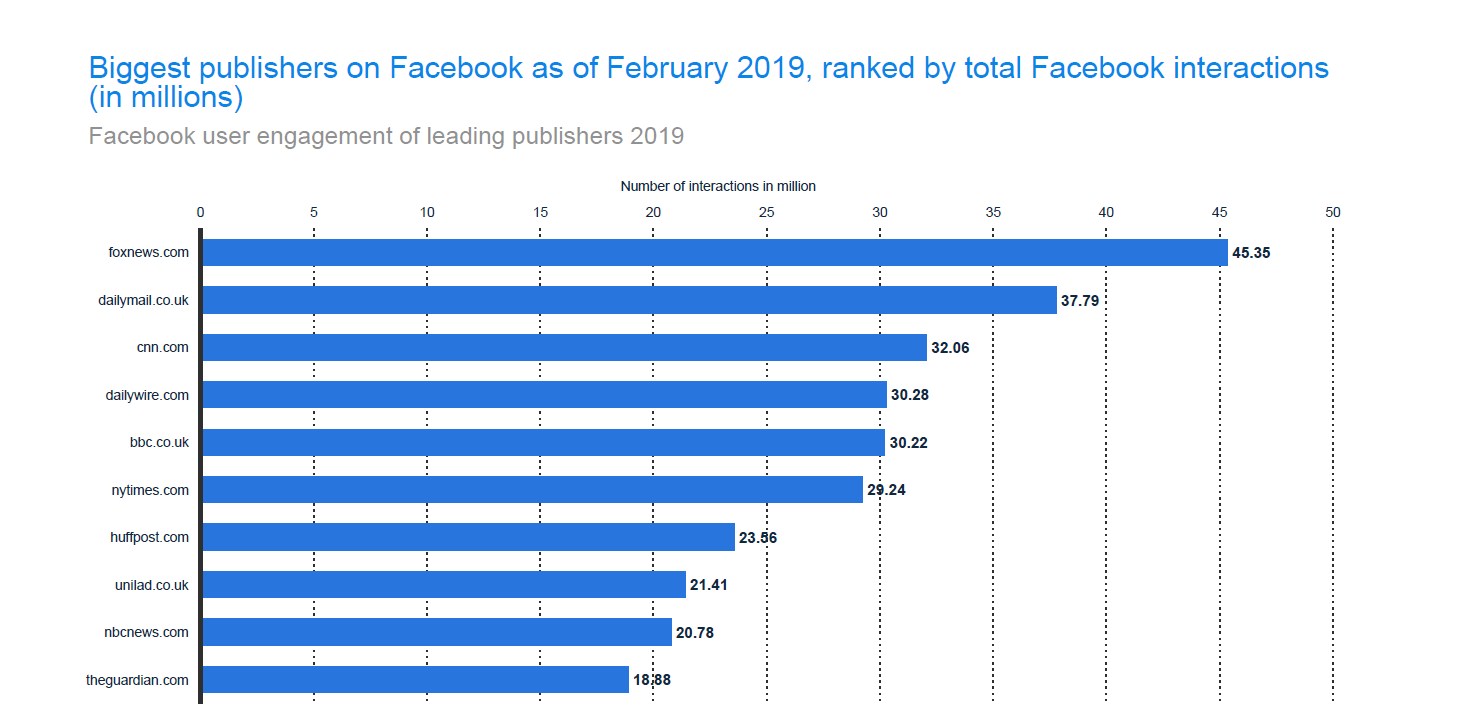
Just like TV brands, online publications are doing quite decently in terms of user engagement on Facebook. Among all English publications, Fox News (US) leads the charts in the total number of interactions with 45.35 million engagements. It’s the only publication with over 40 million. The Daily Mail (UK), CNN (US), Daily Wire (US) and BBC (UK) all have between 30 million and 40 million interactions while The New York Times (US), HuffPost (US), Unilad (UK) and NBC (US) have between 20 million and 30 million. With its 18.88 million engagements, The Guardian (UK) closes the top 10 list of leading publishers in terms of user interactions(source – Statista, pg. 67).
More often than not all eyes are usually on the CNN vs. Fox “beef” with many Facebook users who prefer one outlet throwing jabs at the other. Ultimately, the rivalry contributes to the high level of engagement recorded by the two media houses.
11. Facebook users comment on telco posts more than any other
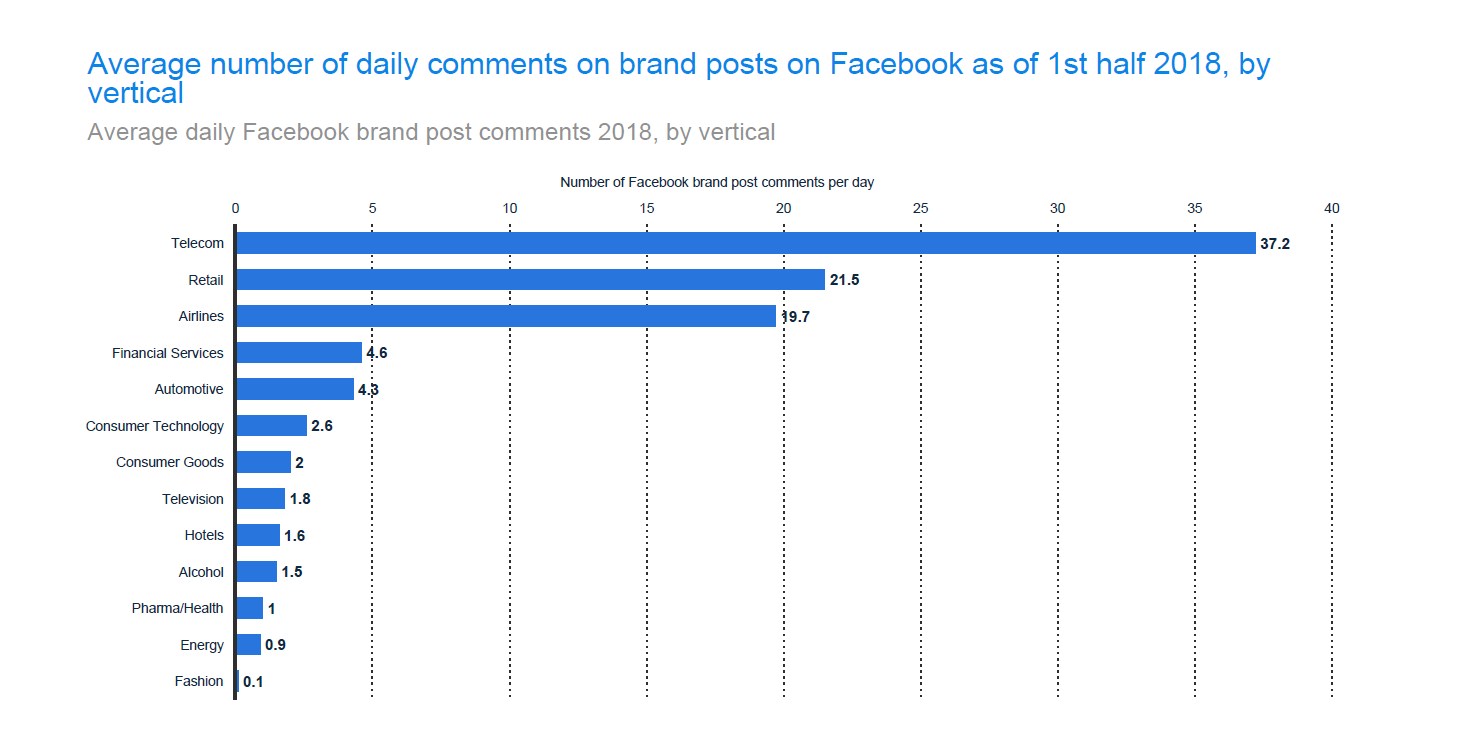
Circling back to Facebook interactions, telco companies get the highest number of comments on their posts. On average, Facebook users comment 37.2 times on posts published by telecom companies. That’s quite a big number, especially since posts by retailers only manage 21.5 comments per day. Airlines, financial services and automotive posts average 19.7, 4.6 and 4.3 comments respectively (source – Statista, pg. 63).
This study (https://marketingland.com/airlines-telecom-companies-facebook-customer-service-16042) may be old but some of its findings still hold. Here’s a summary: brands that get the most number of comments do so because they offer good customer service via social media. With the world going digital, telecom companies are at the center of almost everything, and customers find it easier to raise issues (like downtime and slow connections) via social media. Most telecom companies are more than willing to address the same through social media, which explains why telecom brands had the highest response rate (60.4%) in the said study.
The complaints and responses come in form of comments, and that’s why telecom brands have the highest number of post comments. The above notwithstanding, it’s generally a good idea to respond to as many user questions/complaints/issues as possible. Up to 88% of consumers are less likely to buy from a brand that ignores complaints on Facebook (source – https://marketingland.com/airlines-telecom-companies-facebook-customer-service-16042).
To Sum It All Up…
Facebook makes more advertising revenue than any social media company. With its wide audience of over 2.375 billion monthly active users (source – https://www.statista.com/statistics/264810/number-of-monthly-active-facebook-users-worldwide/), the site makes for a good advertising platform. That’s why it has in excess of 7 million active advertisers (source – https://www.statista.com/statistics/778191/active-facebook-advertisers/). The numbers will only go up seeing as Facebook is leaning more towards mobile-oriented content what with the introduction of Stories. That is to say there will be more ad buyers on Facebook and it will make even more advertising revenue.