

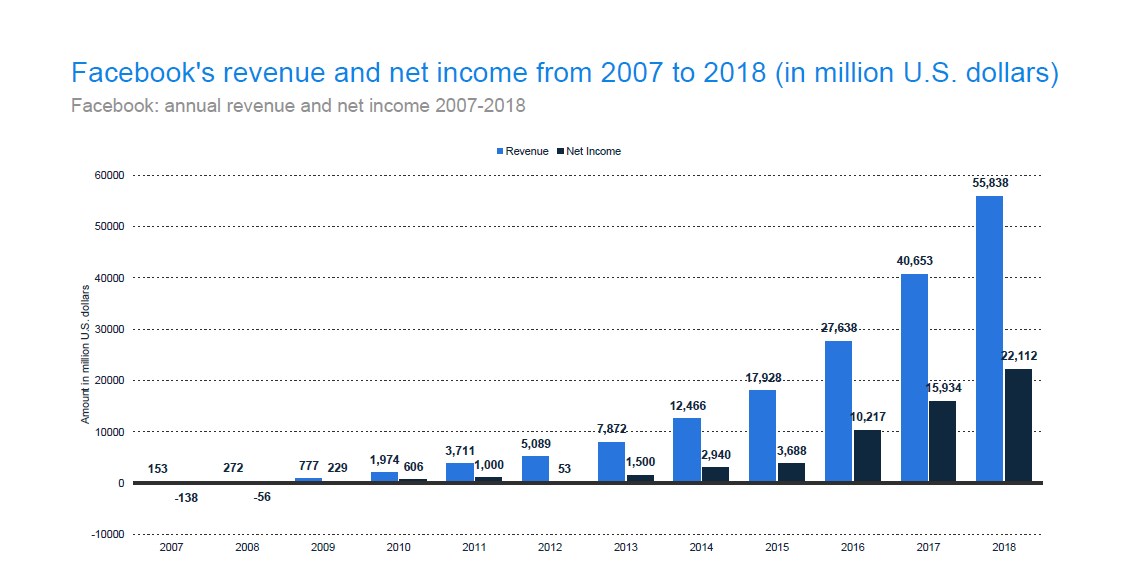
According to Alexa, Facebook is the third most visited site globally after Google and YouTube, which come in first and second respectively (source – https://www.alexa.com/topsites). In terms of revenue, Facebook boasts the top spot in social media rankings, raking in a whopping 55.838 billion dollars in 2018 (source – Statista, pg. 8).
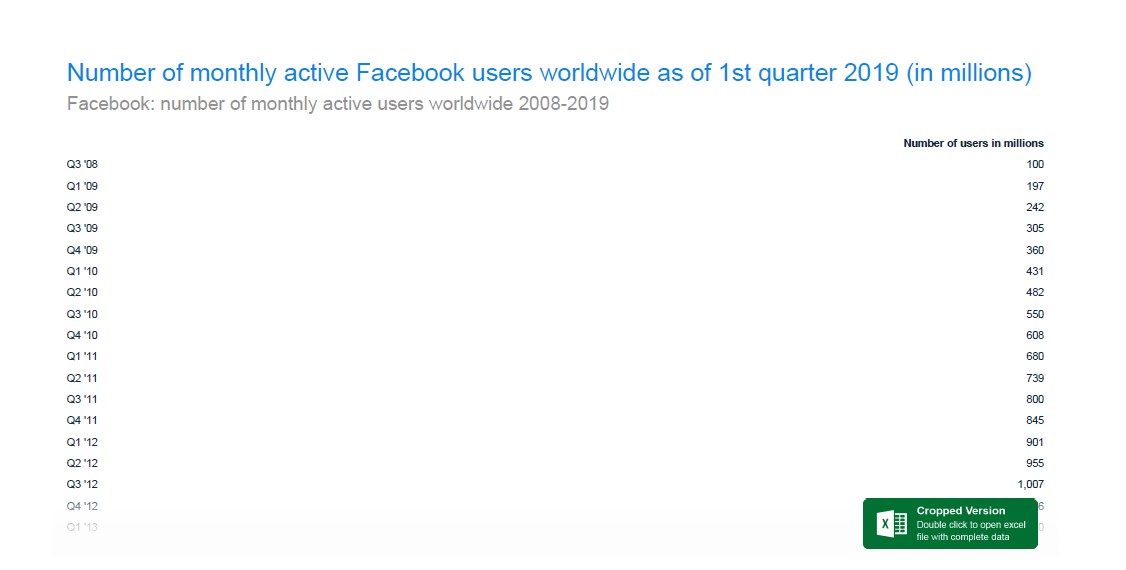
With 2.375 billion monthly active users (source – Statista, pg. 23), it would be accurate to assume that your audience is using Facebook in one way or another; and so are your competitors. However, every so often the tech giant has to deal with legitimate concerns regarding the privacy and security of user data.
For that reason, many people keep asking whether Facebook’s upward trend in revenue generation will persist. That remains to be a point of interest going forward, but meanwhile here are the figures that matter so far in 2019:
1. Facebook is still the highest earning social media company
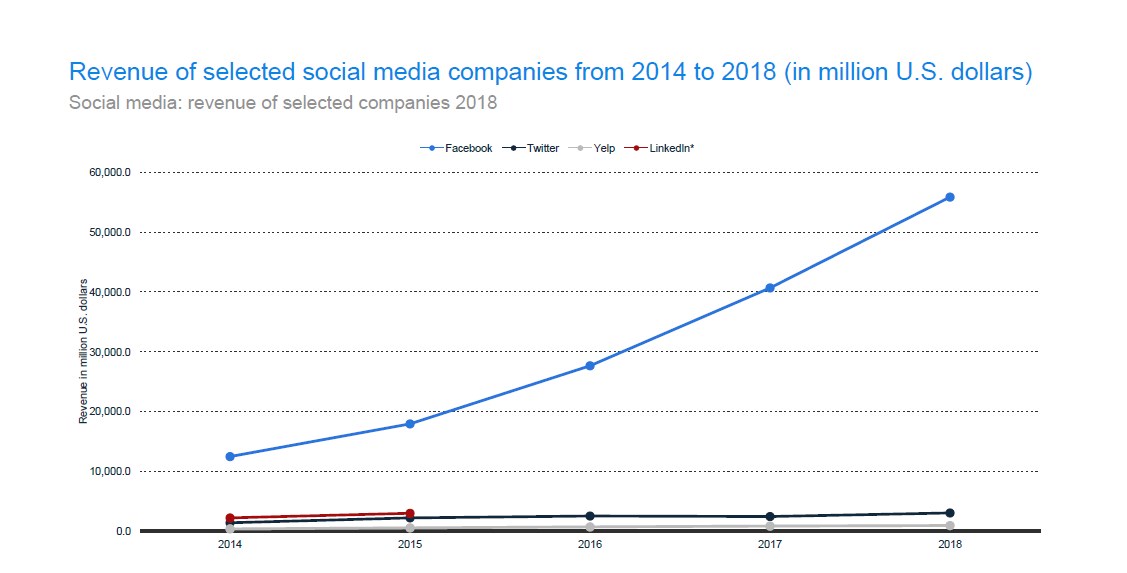
2018 revenue figures stand at 55.838 billion for Facebook, 3.042 billion for Twitter and 942.77 million for Yelp (source – Statista, pg. 18). This is largely down to the fact that Facebook has the highest number of active users. Companies (and individuals) feel that they can reach a higher audience when advertising through Facebook than any other social media platform.
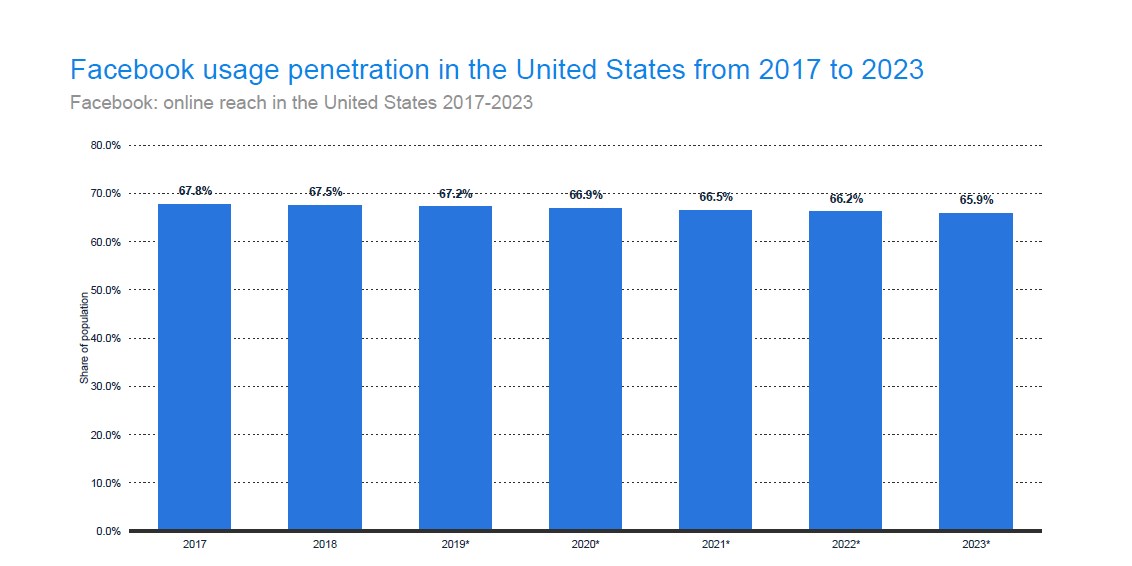
So who is using Facebook? The simple answer is that almost everyone is. As many as 67.5% of Americans have it as their social media network of choice (Statista, pg. 29). The number is even more staggering considering only 35% use Instagram, 29% use Pinterest and 24% use Twitter (Source – https://blog.hootsuite.com/facebook-statistics/).
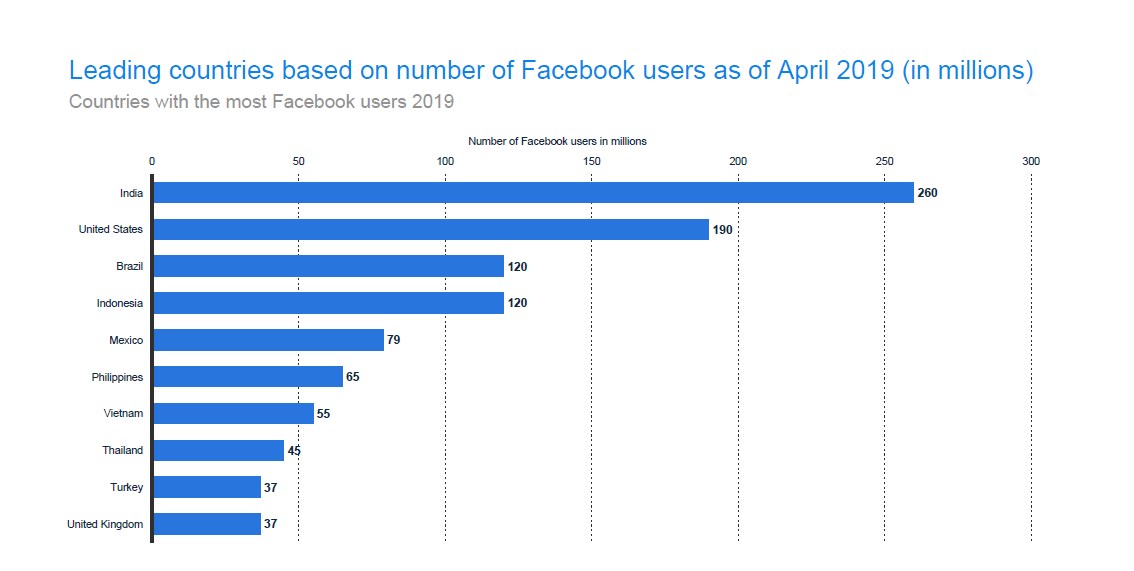
On the global scale, the 190 million Americans who use Facebook represent a mere 10% of the social site’s reach. That’s the second highest of any country, with the top spot reserved for India which has 260 million users (Statista, pg. 28). Global penetration stands at 22.9%, which is (to say the least), quite a huge audience (Source – https://blog.hootsuite.com/facebook-statistics/).
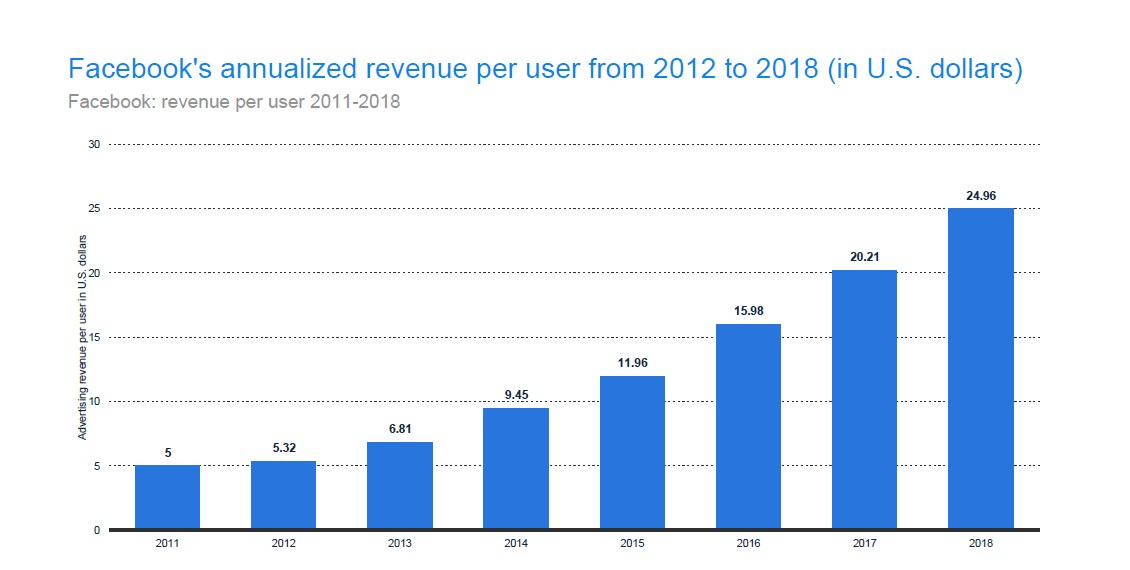
And Facebook is making the best of its audience. Companies that need to reach a wide demographic can post organic content as well as paid ads on the platform. Paid ads are especially important in revenue generation, at least from Facebook’s perspective. In 2018, the company made $24.96 per user, a 23.5% increase from 2017 (Source – Statista, pg. 58) thanks largely to paid ads.
There are questions, however, as to whether the numbers can keep rising. In the US, only half of the teen population uses Facebook. That’s a significantly low figure compared to the 41% of users who are 65 years or older (Source – https://blog.hootsuite.com/facebook-statistics/).
2. Facebook’s revenue and net income have doubled in two years…
Despite a series of scandals and congressional hearings in 2018, Facebook still managed to post record-breaking profits. The company registered a revenue of $55.838 billion and net income of $22.112 billion. In 2016, those values were at 27.638 billion and 10.217 billion respectively (Source – Statista, pg. 8).
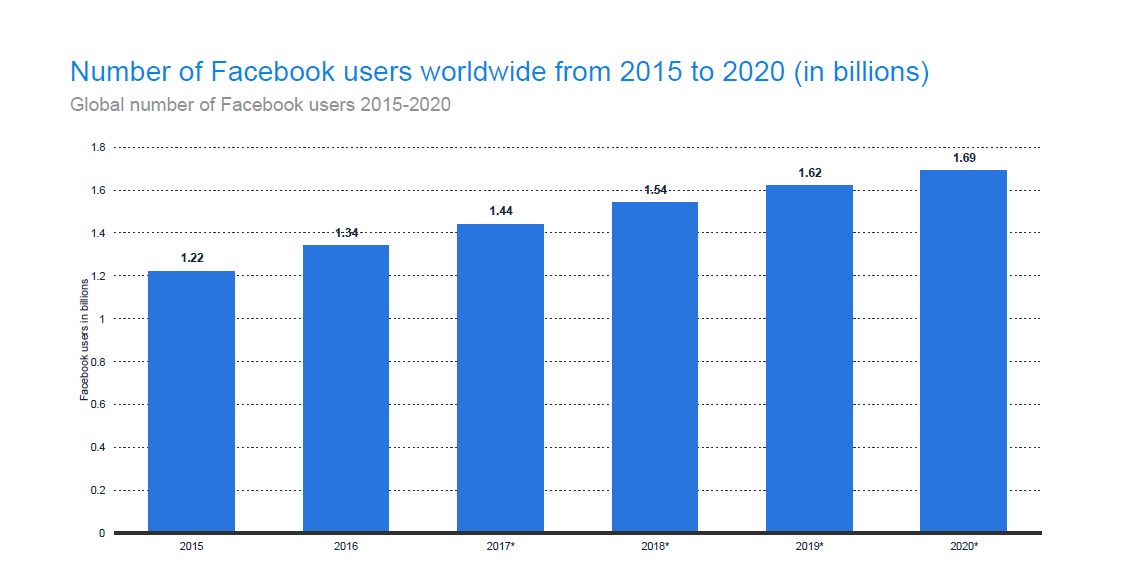
The results indicate that advertisers were hardly deterred by all the controversies. They were still willing to spend money on the networking site. Similarly, most users were hardly troubled seeing as the number of active daily users grew from 1.44 billion in 2017 to 1.54 billion in 2018. It is estimated to reach 1.62 billion by the end of 2019 (Source – Statista, pg. 26).
As the number of users grows so does the Facebook revenue per user. In the run up to 2018, the revenue per user increased consistently, culminating in a 100% increment within three years from 2015 to 2018 (Source – https://blog.hootsuite.com/facebook-statistics/#business).
The rise in revenue can be attributed to Facebook’s drive towards meaningful connections, which have in turn resulted in more user engagements. The grand result is a better platform for monetizing the network mainly through advertisements. Generally, sellers are more willing to pay (and pay more) if their posts will reach a bigger audience resulting in more product sales.
That has been the case considering 78% of American consumers have discovered the retail items to buy on Facebook. The number towers above the 59% registered by both Instagram and Pinterest (Source – https://blog.hootsuite.com/facebook-statistics/#business).
3. …so has the number of full-time Facebook employees
Facebook ended the 2018 calendar year with 35,587 full-time employees, up from 17,048 in 2016. That’s a twofold growth in two years. It’s quite a feat, regardless of how you see it, considering the networking company started with just 7 employees in 2004 (source – Statista, pg. 14).
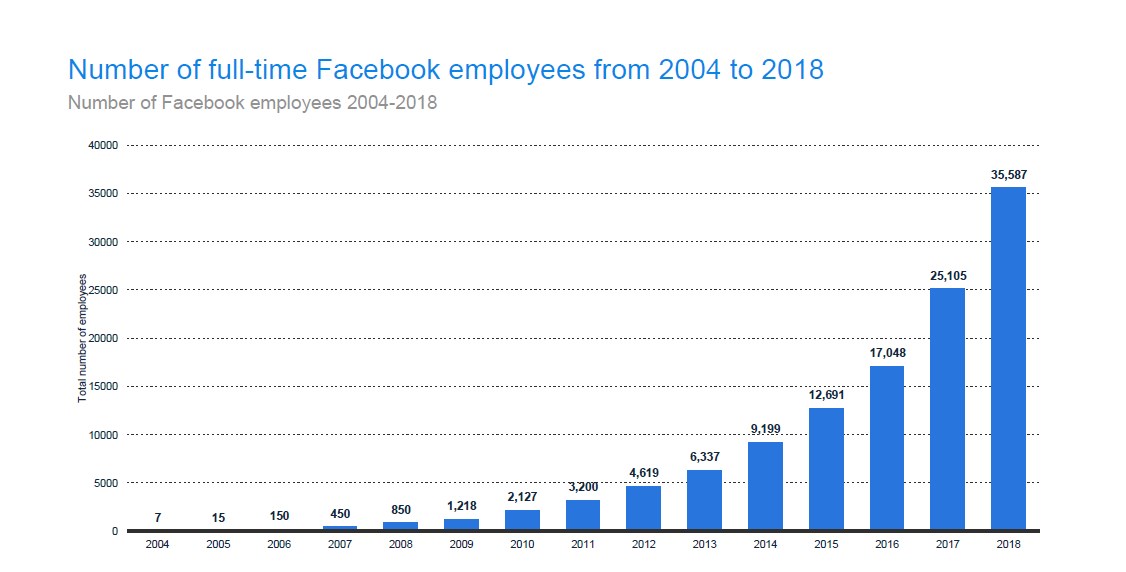
There was a 41.8% increase in the number of employees from 2017 to 2018. It’s worth noting that it was in late 2017 when information came to light regarding Facebook user data being accessed and used by third parties. The public outcry that followed resulted in Facebook announcing a series of changes across its platforms, especially Facebook and Instagram.
January 2018 saw Facebook change the algorithm of its newsfeed. In February, Instagram ads for stories. This feature made it possible to monetize Instagram stories. Facebook followed that up by closing its Messenger apps temporarily then re-opening them, all in the month of March.
In May the tech company introduced categories for dynamic ads as well as tabs for canvas ads. June saw Instagram debut payments for shopping. Seven months after their introduction to Instagram, ads for stories finally made their way to Facebook in September. By October it was possible to view competitor ads on Facebook. Facebook Attribution was then released in November (source – https://www.cpcstrategy.com/blog/2018/12/facebook-in-2018/).
It’s safe to say the company was working hard, not just on introducing revenue-boosting features, but also to fix the privacy and security concerns raised in 2017. Mark Zuckerberg hinted that most of the new hires were employees working on safety and security (source – https://www.pulse.com.gh/bi/tech/facebooks-expenses-rocketed-by-a-massive-dollar10-billion-partly-because-its-costing/s1le27x).
Unsurprisingly, expenses for 2018 hit the $31 billion mark, recording a 51% increase. Needless to say, a big part of the dramatic rise was because of an increased number of employees.
4. 98.5% of Facebook revenue came from advertising
It takes more than social networking to make 55.8 billion dollars in revenue. Facebook is, in fact, a shrewdly run multibillion corporation with a money-generating strategy that works so well.
The company makes its income in two ways. The first is advertising revenue and the second is from payments and other fees. Of the total, 98.5% ($55,013 billion) came from advertising revenue with payments and other fees accounting for only 1.5% (Source – Statista, pg. 9). So much for a network with privacy concerns!
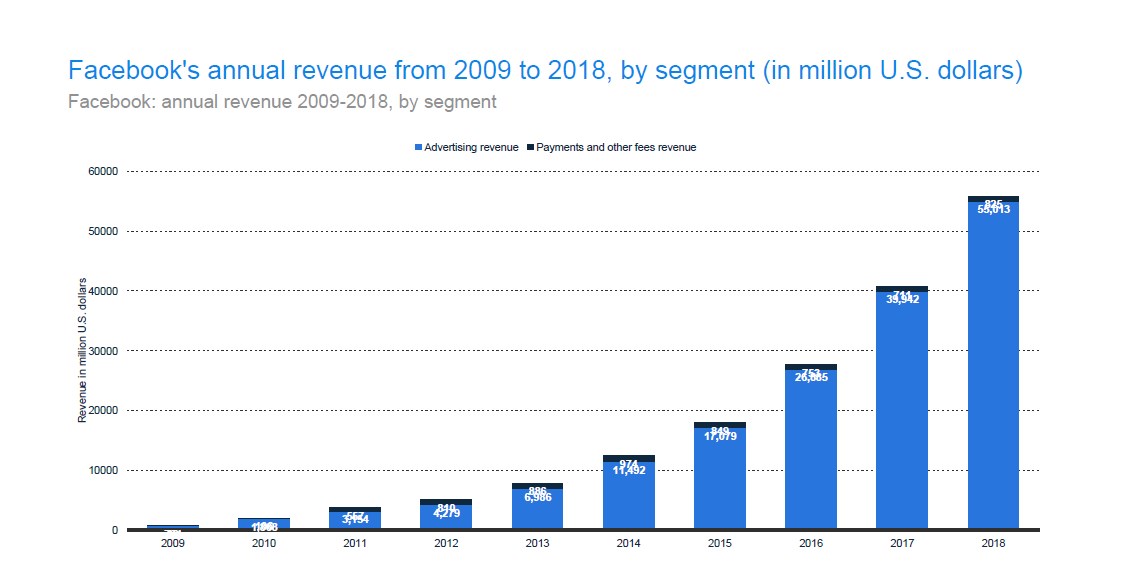
Advertising is obviously the primary source of Facebook’s revenue. And it’s safe to say that despite the criticisms, the tech company will improve, or at the very least keep up the numbers in years to come. Why? Because ad buyers are not deterred by the controversies surrounding Facebook.
In a survey that was conducted by Digiday in November of 2018, 62.1% of ad buyers in agencies and brands that use Facebook ads said that the company’s scandals had no “material impact” on their spending. 50% responded that they would increase their spending (Source – https://digiday.com/marketing/facebook-earnings-q4-2018/).
By the end of the first quarter of 2019, Facebook had 7 million active advertisers (source https://www.statista.com/statistics/778191/active-facebook-advertisers/). Some of them spend top dollar to promote their products. While there are no recent records available, below are some estimates from 2013 (source – https://www.healthnutnews.com/the-35-biggest-advertisers-on-facebook/):
1.Samsung: it is said that Samsung spent $10 million to advertise the Galaxy S III on Facebook in late 2012. The total amount spent on ads that year grossed to $100 million.
2.Proctor & Gamble: P&G have a large presence on Facebook thanks to moms who spend time online. It’s estimated that they spent $60 million on Facebook ads in 2012.
3.Microsoft: Microsoft and Facebook have a longstanding relationship that has seen the latter use Bing as its default search engine. Estimates from 2012 suggest that Microsoft’s expense on Facebook ads totaled $35 million.
4.AT&T
5.Amazon: $30 million
6.Verizon: $30 million
7.Nestle: $30 million
8.Unilever: $30 million
9.American Express: $25 million
10.Walmart
Note that some companies do not have values because the info is based purely on hearsay. It’s helpful to know the big spenders nonetheless.
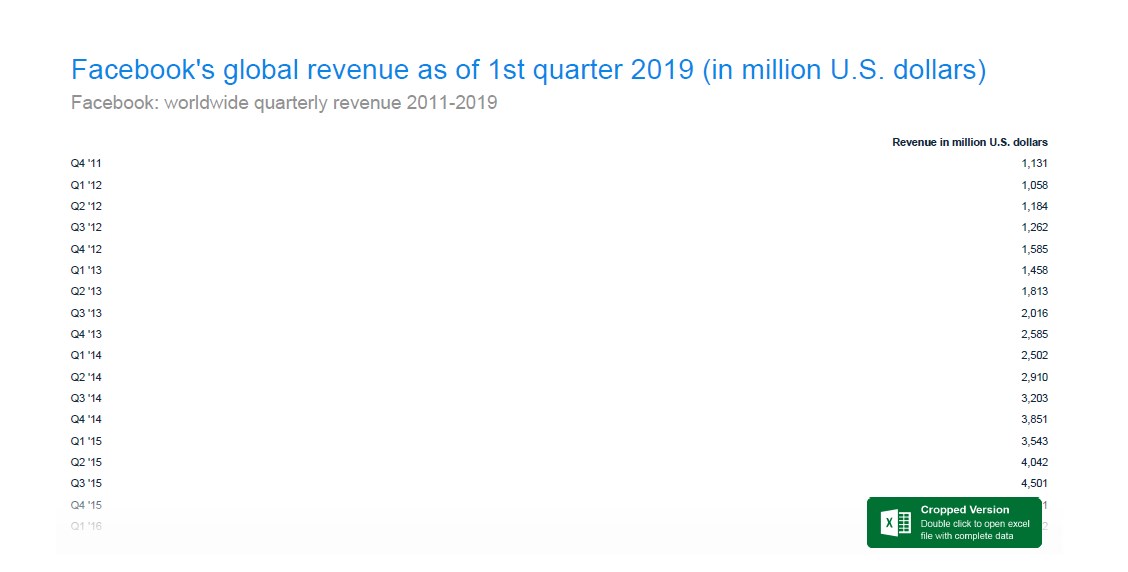
5. A drop in Q1 Facebook revenue is routine
Since its IPO in 2012, Facebook has consistently registered the lowest quarterly earnings in Q1 (out of the 4 quarters of a calendar year). The same seems to be true for 2019.
Despite a strong Q1 earnings report, the social networking company saw a 10.86% decrease in revenue from Q4 of 2018. More specifically, while last quarter of 2018 raked in a massive $16.914 billion, Q1 2019 managed $15.077.
The latter may be a lower figure, but if the normal trend is to continue then Q2, Q3 and Q4 figures should be a lot higher; even higher than Q4 2018 (source – Statista, pg. 10).
Facebook’s earnings per share for Q1 2019 were $0.85. The value would definitely be higher had the company not set aside $3 billion for the anticipated FTC fine. Without the fine earnings per share would be an impressive $1.89 (source – https://techcrunch.com/2019/04/24/facebook-earnings-q1-2019/).
6. Q1 (2019) saw Facebook register a historical drop in net income
So what does the Q1 revenue above mean in terms of profit? Well, Facebook registered a net income of $2.429 billion. That is down from the $4.988 billion recorded in Q1 2018 and $6.882 billion in Q4 2018 (source – Statista, pg. 12). It’s the highest drop ever registered by Facebook from one quarter to another.
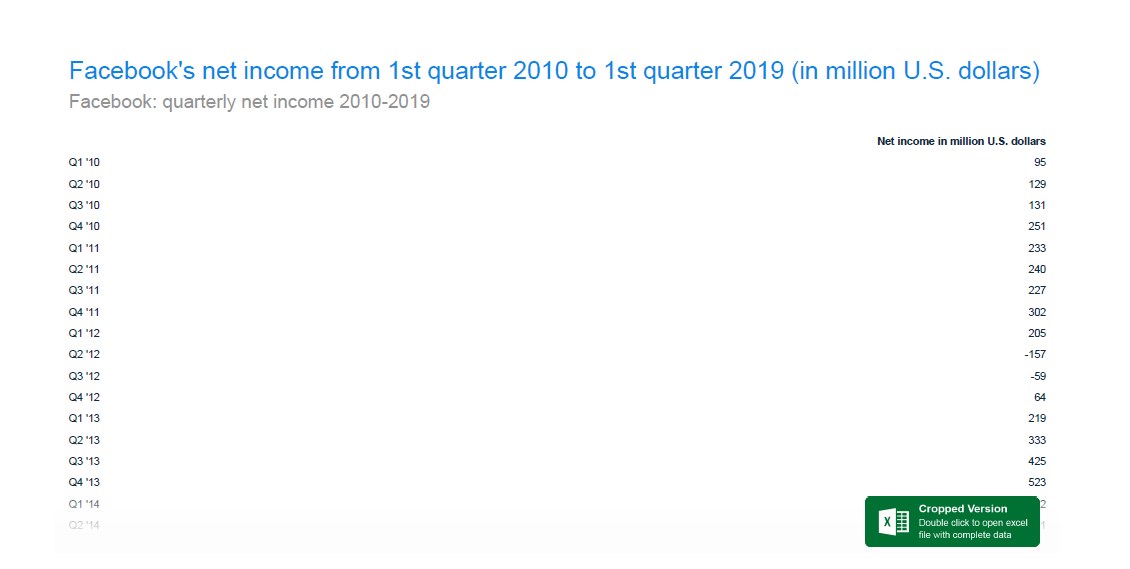
Even so, it did exceed revenue expectations thanks to a 2.5% growth in monthly active users and 2.63% increase in daily active users from the fourth quarter of 2018. And despite a looming FTC fine (and the privacy & security controversies stemming from 2017), Facebook still made profits for investors. Its share price rose to $197.84, an 8.3% increase (source – https://techcrunch.com/2019/04/24/facebook-earnings-q1-2019/).
You may remember that it was just recently, in December 2018, when the share price hit a low of $124.06. The steep rise in share price goes to show that Facebook’s latest revamps of its privacy policy are restoring investor (and ad buyer) confidence. The drive towards accountability saw over 1.3 billion fake Facebook accounts deactivated (source – https://www.vox.com/2018/5/15/17349790/facebook-mark-zuckerberg-fake-accounts-content-policy-update).
It wouldn’t be overstretching to say that Facebook might escape with a lower FTC fine than the $3 to $5 billion being speculated. After all Google only paid $22.5 million! The more likely scenario, however, is that Facebook will pay a hefty fine; perhaps closer to $5 billion than $3 billion. If that happens then the fine might just drag down a future quarter of net income.
7. Facebook made more revenue in Q1 of 2019 than it did the whole of 2014
Trying to make sense of these numbers? Here’s something just as interesting as everything else we’ve seen so far: the revenue recorded in Q1 2019 is more than what Facebook made in the whole of 2014 (i.e. the 4 quarters of 2014 combined)! While the Q1 2019 revenue stands at $15.077 billion, the total revenue for 2014 was $12.466 billion (source – Statista, pg. 10).
If Market Screener projections are anything to go by then the company will register a revenue of $69.414 billion in 2019 (source – https://www.marketscreener.com/FACEBOOK-10547141/financials/). That’s a $56.948 billion increase from the total revenue made in 2014 (or a 456.8% increment). It means that Facebook has been growing at an average rate of 91.4% over the past 5 years.
Now, to zoom all this out: the number of daily active users is growing, that of monthly active users is growing too, earnings per share are increasing and stock prices are rising. Things may look a little bleak and uncertain legally but the financial side is undoubtedly nice and sunny. That’s the only side that investors are interested in.
To put it simply, no matter what the public perception of Facebook is, the company is doing better than ever; even better than many analysts first anticipated when it became imminent that Facebook was going to be slapped with a multibillion dollar fine.
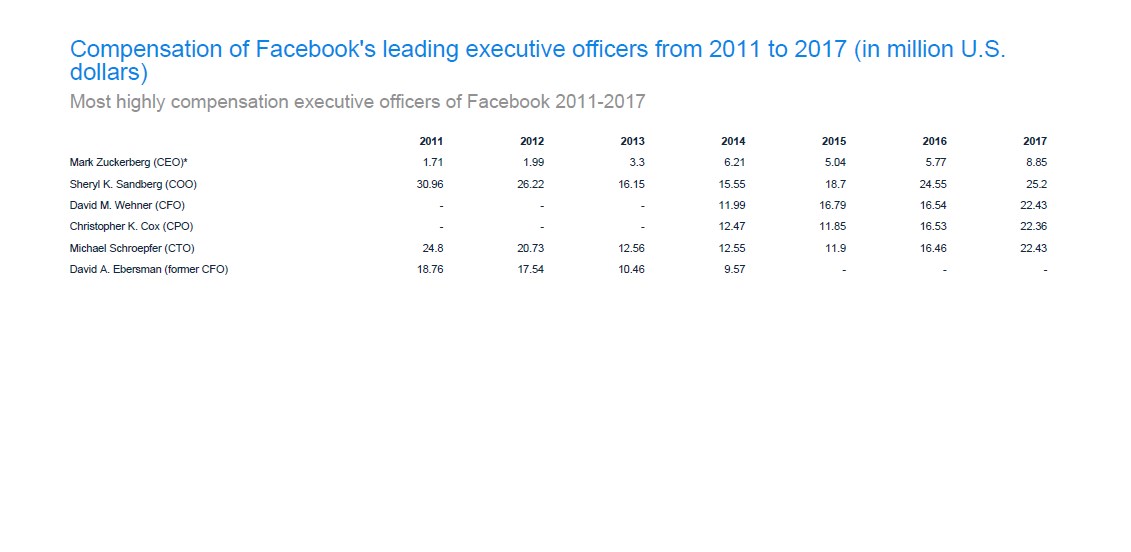
8. Mark Zuckerberg is NOT the highest compensated executive officer of Facebook
Okay, this was expected. Its public information that the Facebook founder and CEO earns a salary of $1 per year and doesn’t take home any annual bonus. He, however, gets millions of dollars in “other compensations”. Still, that puts him a distant fifth in the ranking for the highest compensated Facebook executive officers (source – Statista, pg. 13).
The top spot is claimed by Sheryl K. Sandberg, the COO. Her total compensation for the fiscal year ended in 2018 was $23,728,418 (source – https://www1.salary.com/Sheryl-K-Sandberg-Salary-Bonus-Stock-Options-for-FACEBOOK-INC.html), down from the $25.2 million she received the previous year.
CFO, David M. Wehner, bagged a total of $19,686,113, which is also a drop from the $22.43 million that he earned in 2017. There were reductions across the board with the now former CPO, Christopher K. Cox, receiving $19,986,113, down from $22.36 million and CTO Mike Schroepfer earning a total of $19,757,363, down from $22.43 million.
So why does Zuckerberg earn just one dollar despite being the CEO? Well, it’s not uncommon for executives with an extremely high net worth to forego their salaries and bonuses. Elon Musk (Tesla Motors and Space X), Eric Schmidt (Google), Jack Dorsey (Twitter), Jan Koum (WhatsApp), Jerry Yang (Yahoo), Larry Ellison (Oracle Corporation) and William Clay Ford Jr. (Ford Motors) all do it (source – https://en.wikipedia.org/wiki/One-dollar_salary#Recent_examples).
There may not be clear reasons why these (and many more) executives earn $1, but motives range from keeping the cost of salaries low (to avoid having to lay off workers) to prioritizing philanthropy. Either way, Zuckerberg still enjoyed over $22 million in “other compensations”, up from just $9 million in 2017 (source – https://techcrunch.com/2019/04/12/facebook-spent-20-million-last-year-on-zuckerbergs-personal-protection/).
A huge chunk of it, nearly $20 million, was spent on Zuckerberg’s personal security, with only $2 million going to his personal travels via private jet (source – https://techcrunch.com/2019/04/12/facebook-spent-20-million-last-year-on-zuckerbergs-personal-protection/). That was perhaps justified, seeing as 2018 was a very scandalous year for Facebook and some sections of the public were very angry towards Facebook as a company and Zuckerberg as a person.
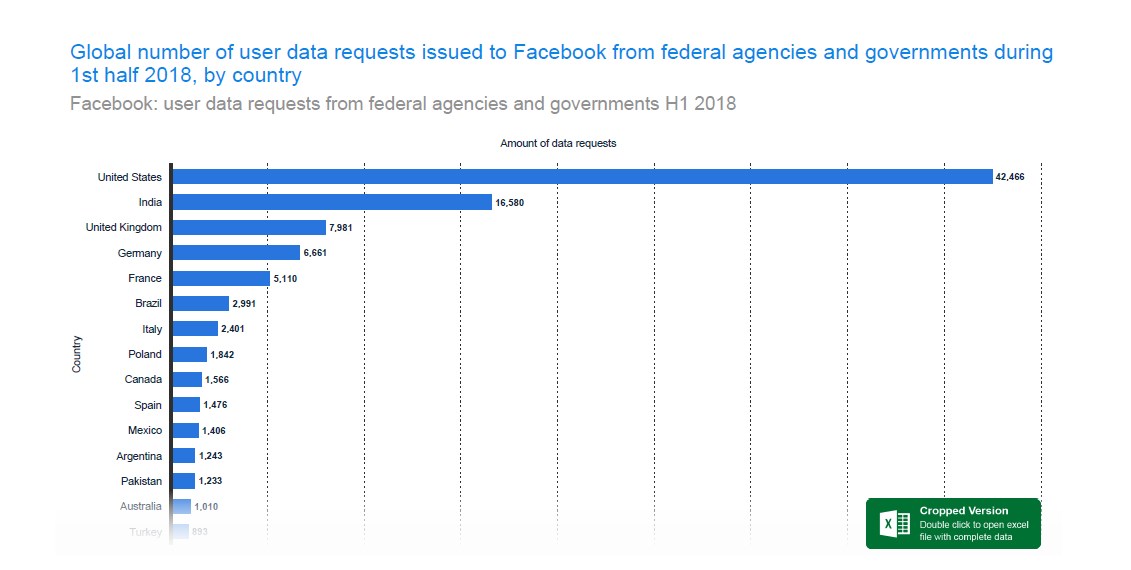
9. US government agencies made 42,466 requests for user data in the first half of 2018
Worried that the government might be using your Facebook data to track your activities? You just might be right! In the first six months of 2018, US government agencies made a whopping 42,466 requests for user data; the most by any government or federal agency.
To put it into perspective, that’s nearly as much as what the other 9 countries in the top 10 requested, combined! India came in second with 16,580 requests, which is less than half of the requests made by the US (source – Statista, pg. 16).
So, what do you need to know about these requests? And how can they potentially impact the amount of Facebook revenue? For starters, they are more of demands than requests. In fact they are popularly known as “national security letters” or NSL for short.
An NSL is effectively a subpoena issued to compel a company to turn over data on a particular individual who is being investigated. The main reason why NSLs are controversial is because they have a gag order that prevents the informing company, in this case Facebook, from telling the subject of the letter about its existence, let alone its contents.
Facebook may be forced to hand over a user’s metadata, online purchase information, IP addresses of the people s/he communicates with, cell-site locations and so much more (source – https://techcrunch.com/2018/11/15/facebook-releases-national-security-letters-for-customer-data/).
If the government keeps up the practice there’s every possibility that it might draw some backlash from the public, particularly Facebook users. Those who are extremely concerned about their privacy and security might take the leap and delete their Facebook accounts. It would take tens or hundreds of millions of people to delete their accounts for Facebook to feel the impact on its revenue.
Can that happen in future? That’s hard to say for certain. One thing for sure is that the government seems intent on continuing to make requests. In the second half of 2018 it made 41,336 NSL requests (source – https://www.statista.com/statistics/287845/global-data-requests-from-facebook-by-federal-agencies-and-governments/) to bring the 2018 total to 83,808.
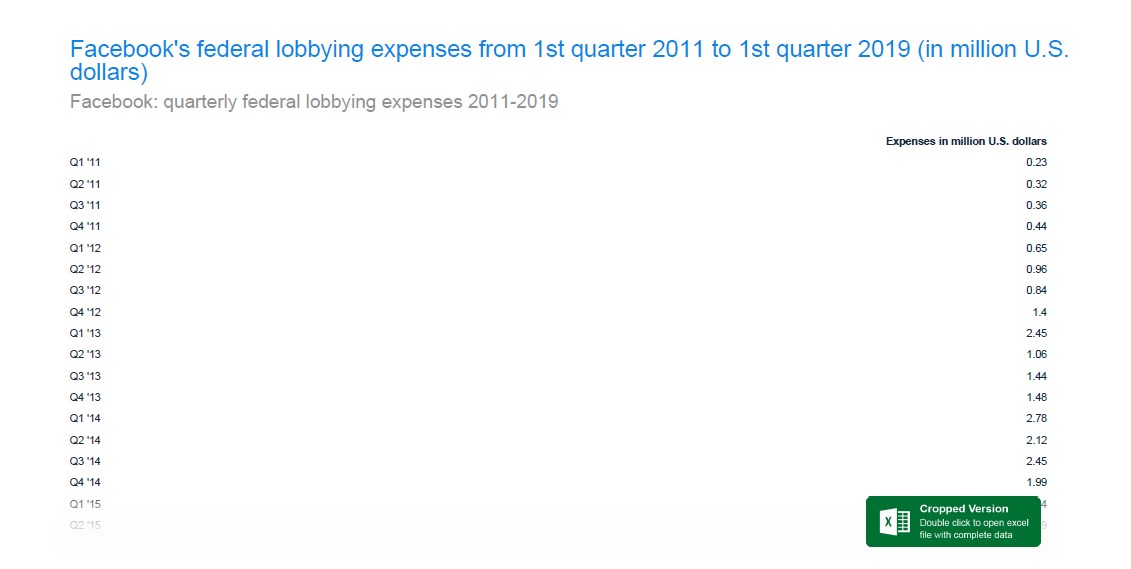
10. Facebook spent 3.4M in federal lobbying in Q1 2019, nearly as much as it did in Q2 of 2018
You will remember that it was in Q2 of 2018 (April) when Mark Zuckerberg was summoned by lawmakers for a congressional hearing following Facebook’s data leak to third parties. Understandably, Facebook spent $3.67 million in federal lobbying; the highest amount to date. It’s closely followed by the $3.4 million spent in Q1 2019 (source – Statista, pg. 17).
The need for federal lobbying arises from the fact that Facebook makes its revenue through ads, which are only effective once the social site collects specific user data. In other words, if Facebook is prohibited from collecting user data it won’t be able to make as much profit as it currently does.
With the government increasing scrutiny, Facebook (and other social networking companies) runs the risk of antitrust regulations. It therefore has to lobby for favorable laws. In doing so, expenses increase; but of course at the benefit of being able to make more revenue from less stringent antitrust laws.
11. WhatsApp is still Facebook’s most expensive acquisition
Facebook’s acquisition of WhatsApp, in a deal that cost 19 billion dollars, is by far the most expensive purchase made by Facebook to date. It dwarfs the $2 billion acquisition of Oculus.
According to Facebook’s Form 10-Q of 2014, WhatsApp generated a total revenue of $1,289,000 in the 9 months preceding September 30th of the same year (source – https://www.investopedia.com/articles/personal-finance/040915/how-whatsapp-makes-money.asp). At the time it had roughly 700 million users.
There was a twofold strategy for making money. In some countries users paid $1 to download the app while in others they got it for free in the first year, after which a $1 subscription fee was charged for subsequent years.
Facebook has since done away with that strategy. It’s not clear exactly how WhatsApp brings in money but it is estimated that the total revenue stands at $5 billion per year and is expected to hit $4 per user by 2020 (source – https://www.investopedia.com/articles/personal-finance/040915/how-whatsapp-makes-money.asp). Needless to say, the amount contributes to the total Facebook revenue.
The Takeaway Point
The bottom line here is that Facebook is an extra-ordinary profit-generating company. To a large extent, public perception doesn’t matter as much as you would think. The company has a working strategy for making money, and it’s sticking to its trade. With a rising number of users and ad buyers, it’s safe to say that Facebook revenues will continue to grow.